Fig. 2
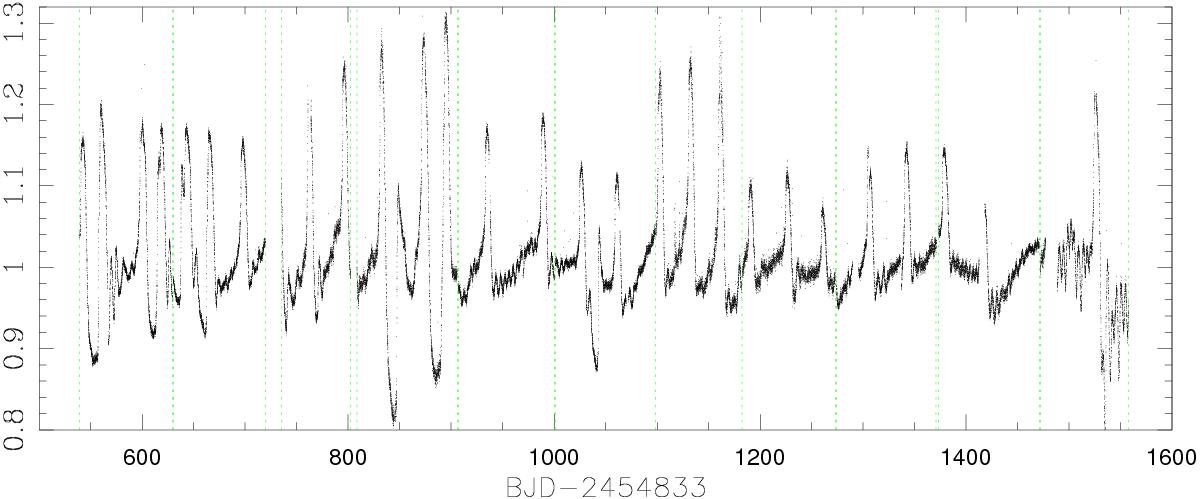
Complete Kepler LC data set for V523 Lyr. Dashed green vertical lines delimit the beginning and end of each quarter. Y units correspond to median-normalized counts where each quarter has been normalized independently and stitched together. Note the numerous small outbursts with dips often following them, and the system becomes slightly fainter after each outburst and rises in brightness until the next. See text for more details.
Current usage metrics show cumulative count of Article Views (full-text article views including HTML views, PDF and ePub downloads, according to the available data) and Abstracts Views on Vision4Press platform.
Data correspond to usage on the plateform after 2015. The current usage metrics is available 48-96 hours after online publication and is updated daily on week days.
Initial download of the metrics may take a while.