Free Access
Fig. 2
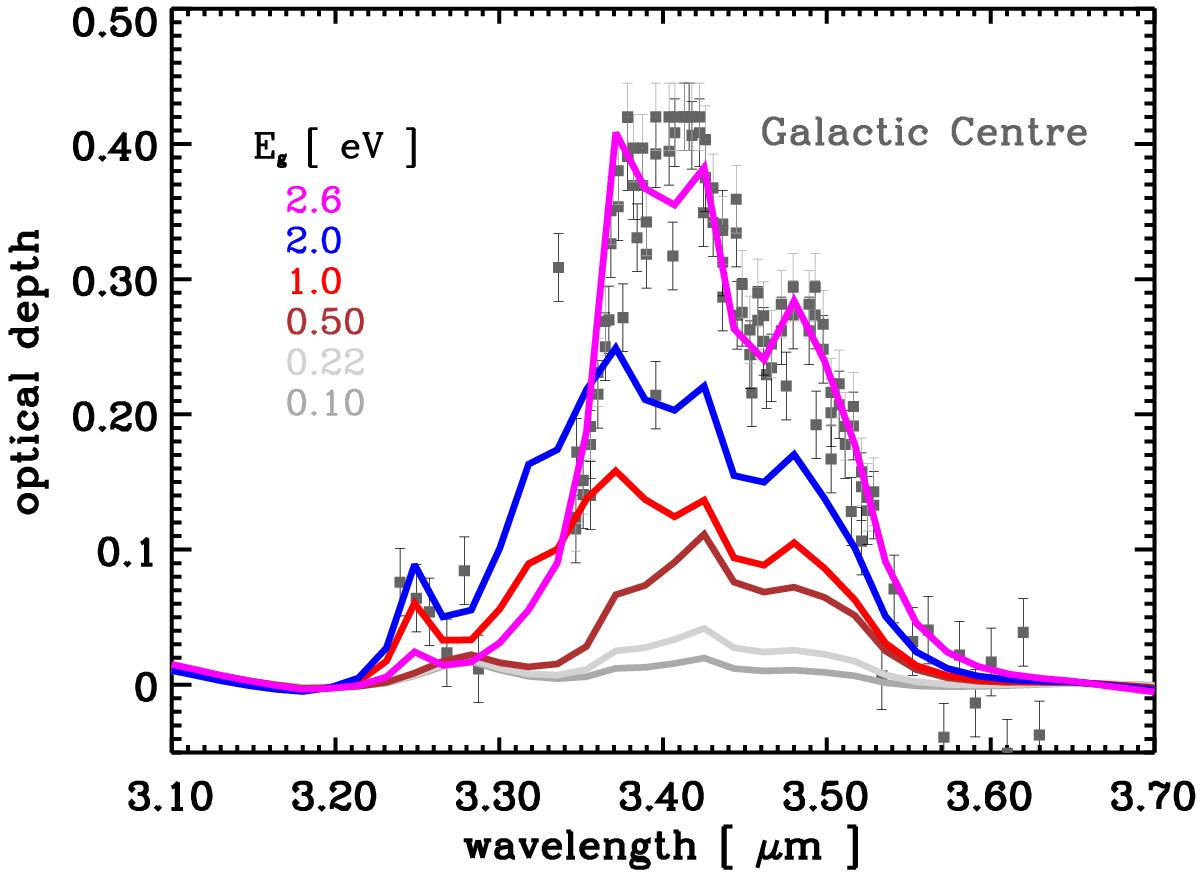
Continuum-subtracted 3−4 μm region optical depth data from Fig. 1. Also shown are the scaled-to-fit spectra of the Galactic centre towards IRS6E and Cyg OB2 No. 12 (grey squares, Pendleton & Allamandola 2002).
Current usage metrics show cumulative count of Article Views (full-text article views including HTML views, PDF and ePub downloads, according to the available data) and Abstracts Views on Vision4Press platform.
Data correspond to usage on the plateform after 2015. The current usage metrics is available 48-96 hours after online publication and is updated daily on week days.
Initial download of the metrics may take a while.