Fig. 3
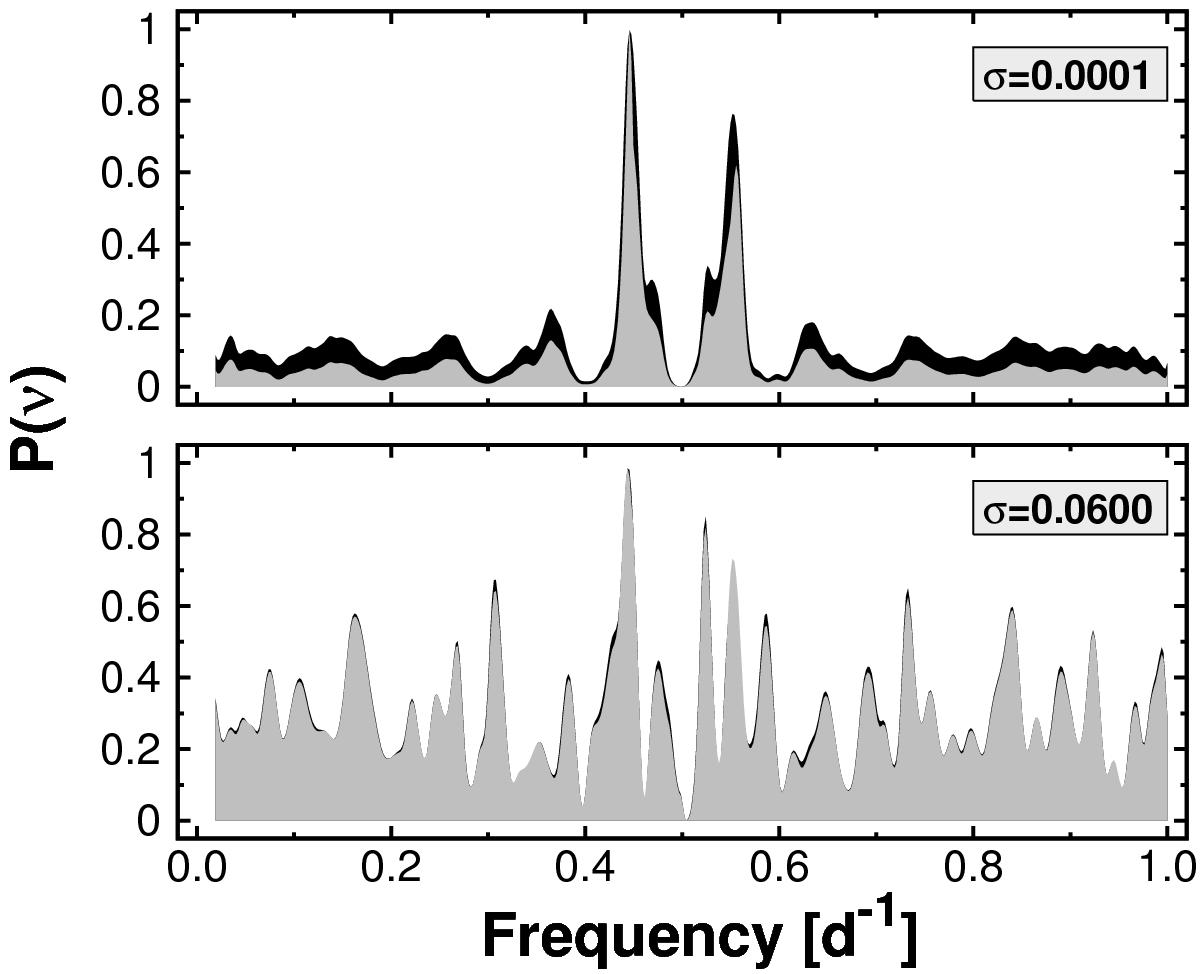
Illustration of the dependence of the frequency spectra on noise level (upper vs. lower panels) and on the method of data analysis (lighter shade: full time series model; darker shade: partial time series model). In this example the frequency of the test signal is 0.446 d-1, very close to that of the systematics. Farther away from the frequency of the systematics the difference between the two methods is much smaller, even in the noiseless case.
Current usage metrics show cumulative count of Article Views (full-text article views including HTML views, PDF and ePub downloads, according to the available data) and Abstracts Views on Vision4Press platform.
Data correspond to usage on the plateform after 2015. The current usage metrics is available 48-96 hours after online publication and is updated daily on week days.
Initial download of the metrics may take a while.