Fig. 2
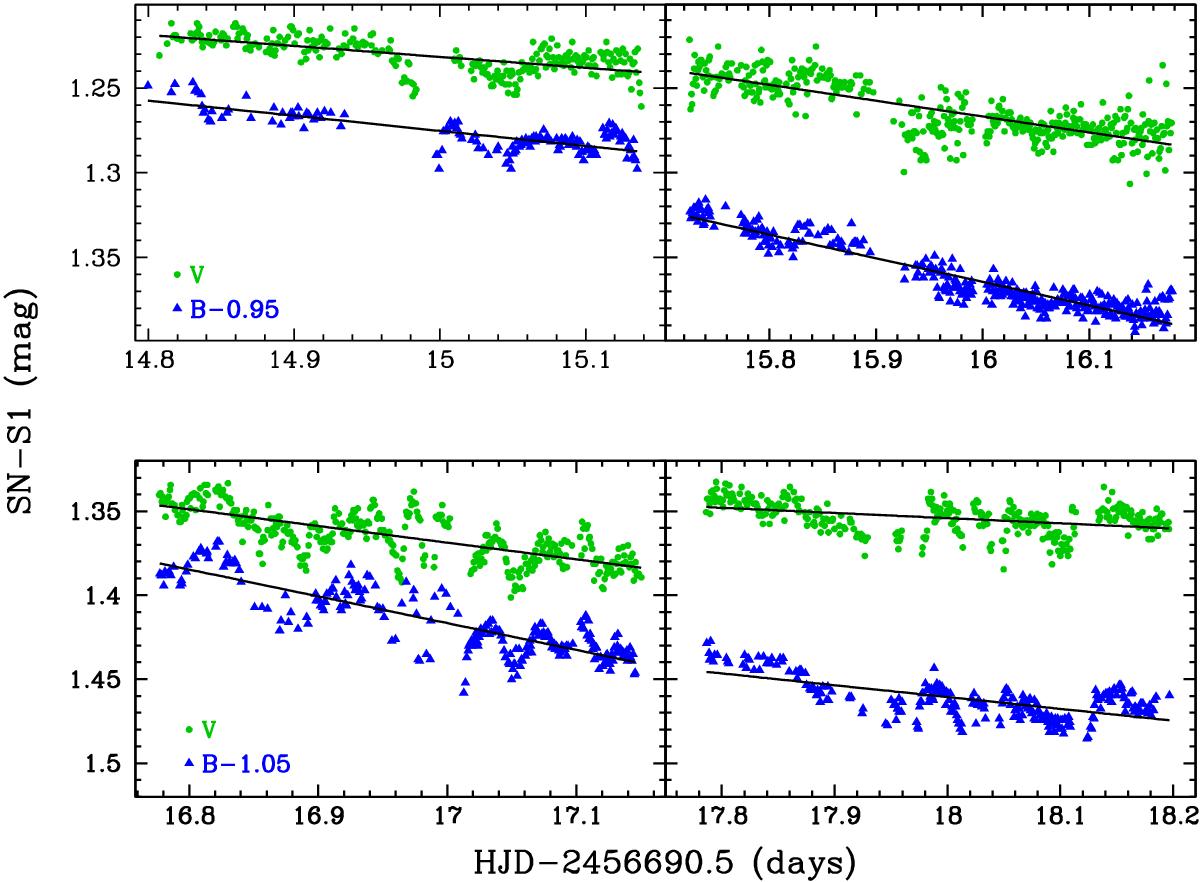
Calibrated V-band (circles) and B-band (triangles) differential light curves of SN 2014J, compared with Star 1, as a function of the time in days measured since tmax(B) = 2 456 690.5 (JD; Foley et al. 2014). Each panel corresponds to one night of observations. The B-band curves are offset by 0.95 mag in the upper panels and 1.05 mag in the lower panels for clarity. The black lines represent least-square fits to the photometry.
Current usage metrics show cumulative count of Article Views (full-text article views including HTML views, PDF and ePub downloads, according to the available data) and Abstracts Views on Vision4Press platform.
Data correspond to usage on the plateform after 2015. The current usage metrics is available 48-96 hours after online publication and is updated daily on week days.
Initial download of the metrics may take a while.