Fig. 5
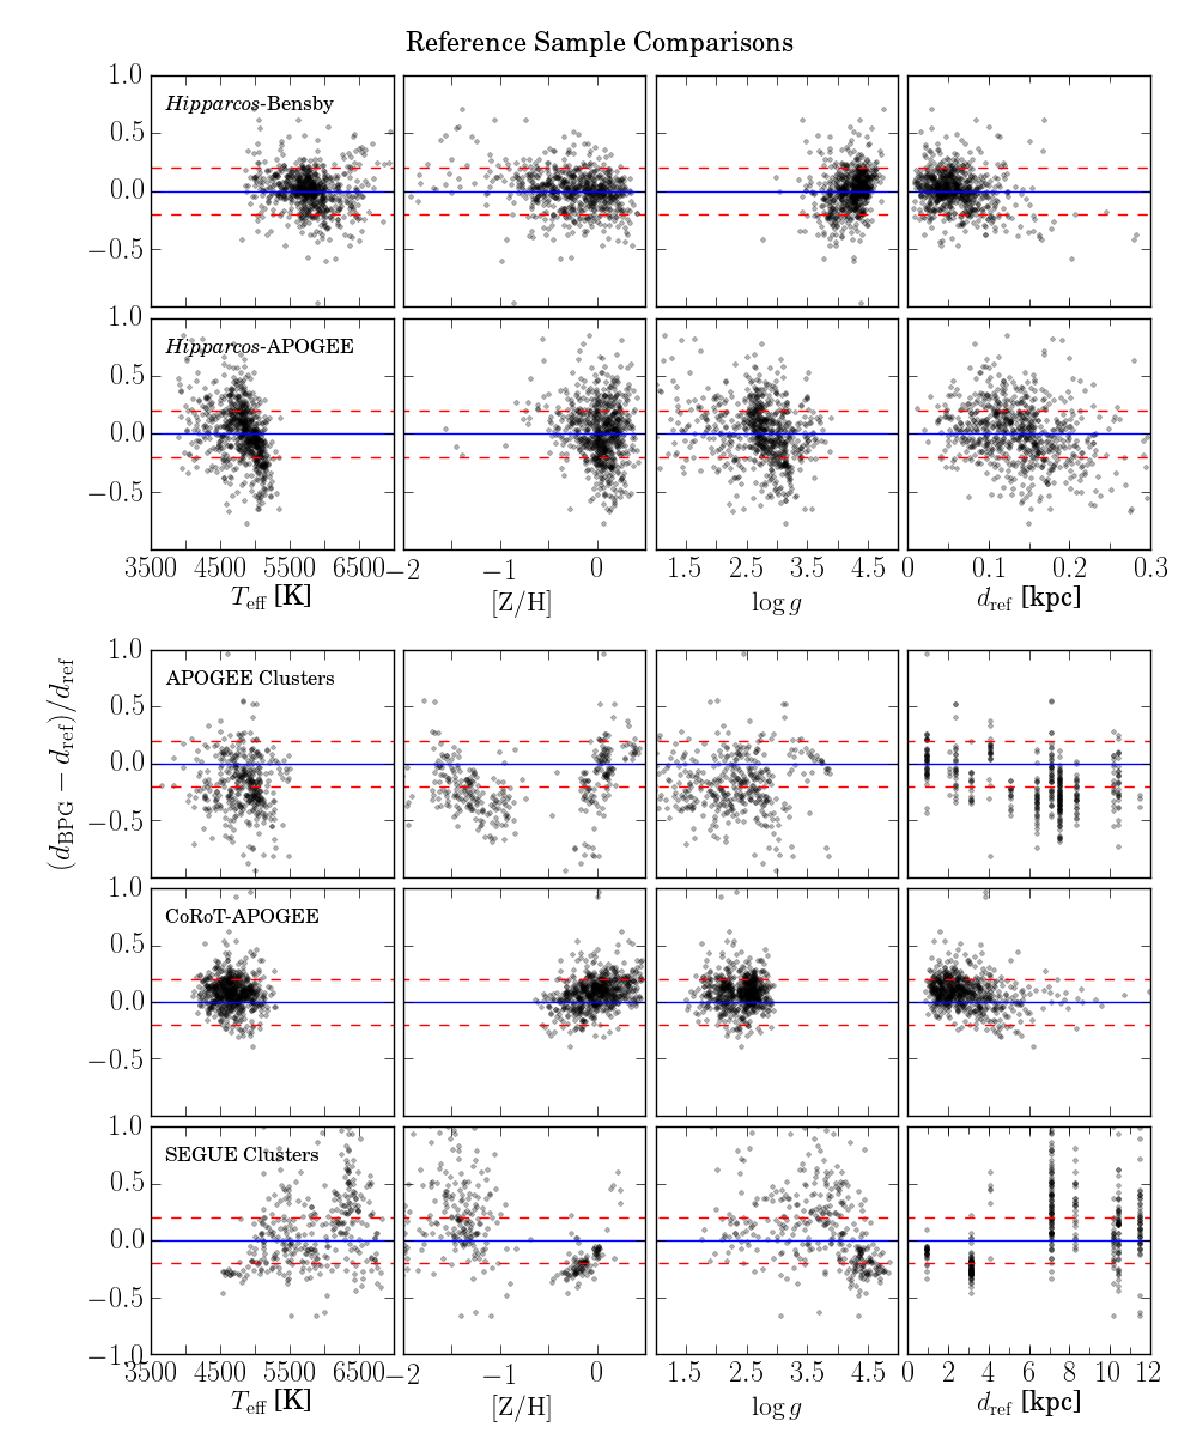
Relative distance residuals (estimated – reference) as a function of the main spectroscopic parameters Teff, [Z/H] and log g as well as the reference distances dref. Top rows: comparison to the astrometric distance scale provided by the Hipparcos satellite, using the Bensby et al. (2014) FGK dwarf sample (1st row) and the APOGEE-Hipparcos giant sample (2nd row). 3rd row: APOGEE clusters. 4th row: CoRoT-APOGEE sample. 5th row: SEGUE clusters. The central dashed line is the identity line, whereas the upper and lower lines indicate deviations at the 20% level.
Current usage metrics show cumulative count of Article Views (full-text article views including HTML views, PDF and ePub downloads, according to the available data) and Abstracts Views on Vision4Press platform.
Data correspond to usage on the plateform after 2015. The current usage metrics is available 48-96 hours after online publication and is updated daily on week days.
Initial download of the metrics may take a while.