Fig. 4
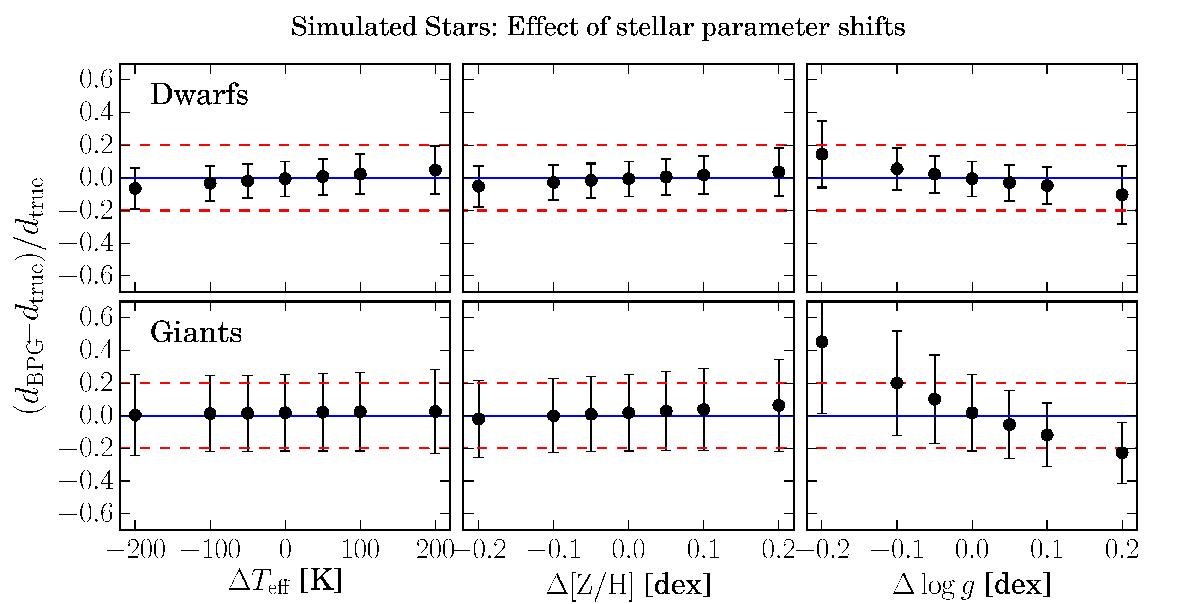
Effects of systematic shifts in the spectroscopically observed stellar parameters Teff (left), [Z/H] (middle) and log g (right panels) on our determined distances. For this exercise, we again use the simulated PARSEC sample with high-resolution-like observational errors and the full input parameter set (set 1: x = {[M/H] ,Teff,log g,m,colours}). In each panel, the errorbars show the mean and standard deviation of the relative distance errors, as a function of the value of a fixed shift in the particular stellar parameter. Dwarfs (log g> 4) and giants are shown separately in the top and bottom rows, respectively.
Current usage metrics show cumulative count of Article Views (full-text article views including HTML views, PDF and ePub downloads, according to the available data) and Abstracts Views on Vision4Press platform.
Data correspond to usage on the plateform after 2015. The current usage metrics is available 48-96 hours after online publication and is updated daily on week days.
Initial download of the metrics may take a while.