Fig. 6
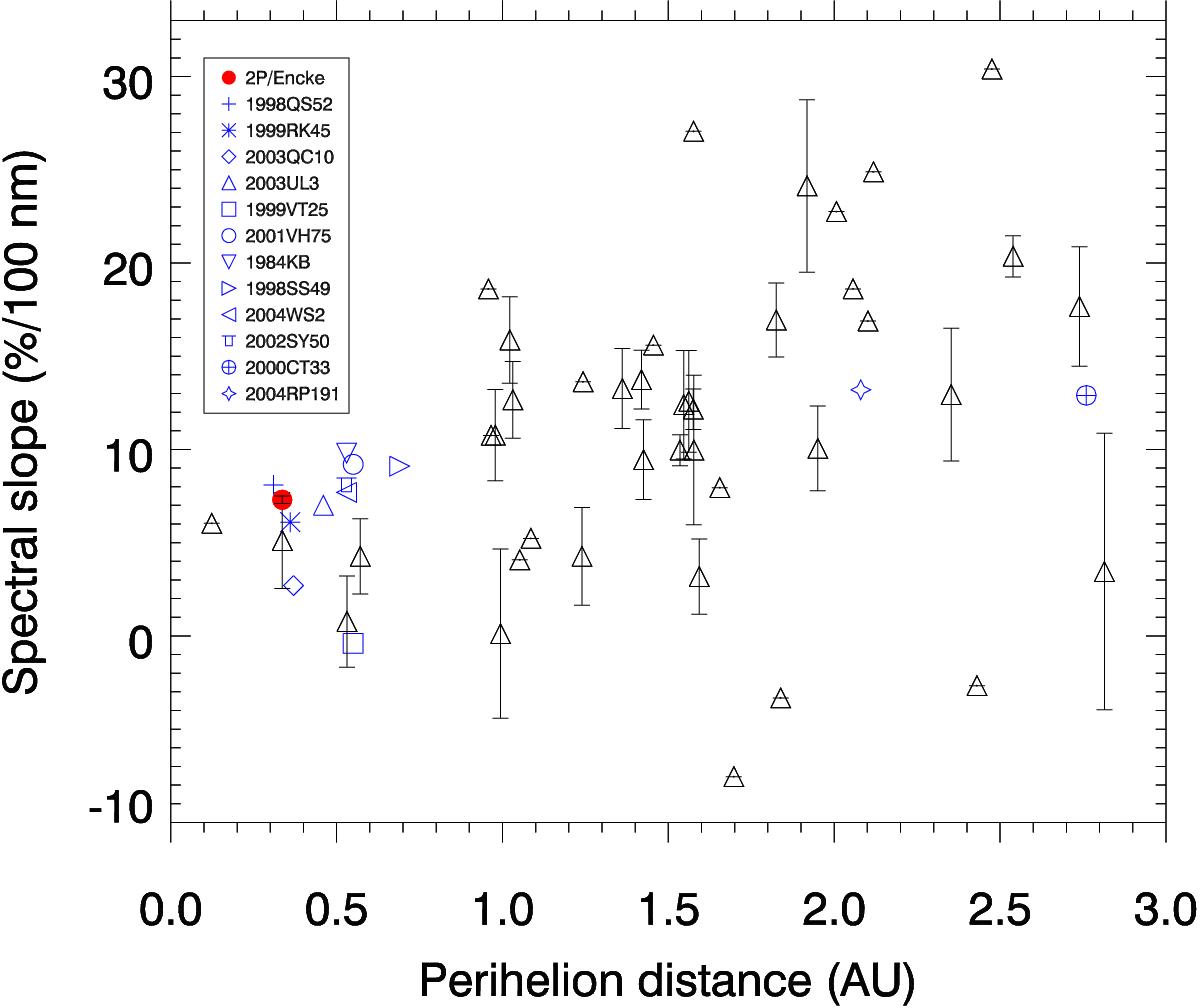
Spectral slope versus perihelion distance, where a weak trend of steeper slopes at larger distances is found. Data taken from the MBOSS colour database (Hainaut et al. 2012). The red filled circle and the blue symbols correspond to the spectral slope of the spectrum of 2P/Encke and the observed asteroids, respectively, determined in this work (wavelength range Δλ = 420–750 nm).
Current usage metrics show cumulative count of Article Views (full-text article views including HTML views, PDF and ePub downloads, according to the available data) and Abstracts Views on Vision4Press platform.
Data correspond to usage on the plateform after 2015. The current usage metrics is available 48-96 hours after online publication and is updated daily on week days.
Initial download of the metrics may take a while.