Free Access
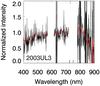
Fig. 5
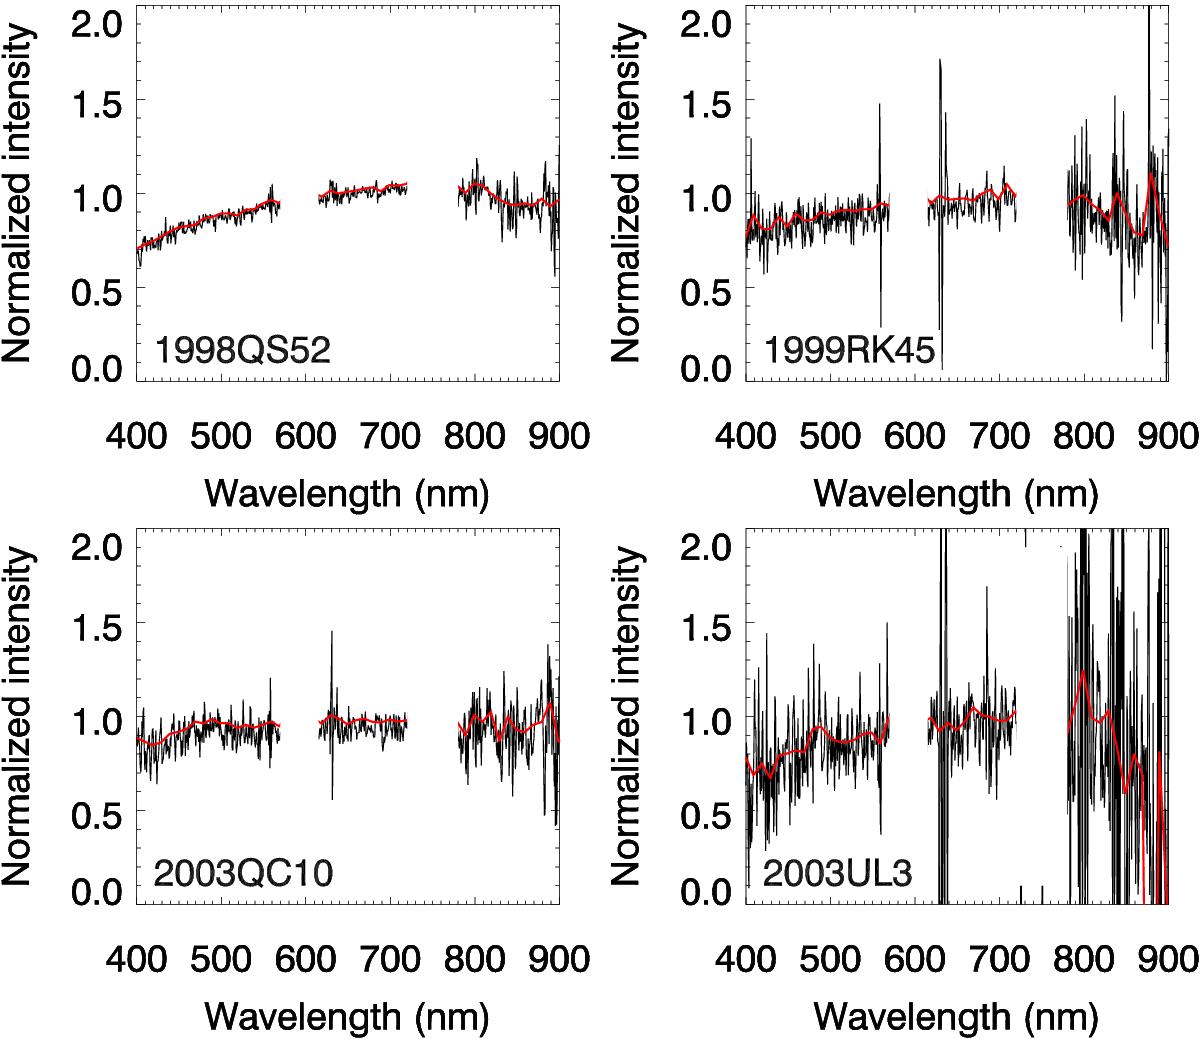
Low resolution spectra of 1998 QS52, 1999 RK45, 2003 QC10, and 2003 UL3. The spike visible at about 650 nm is a skyline not completely removed during the spectra reduction.
This figure is made of several images, please see below:
Current usage metrics show cumulative count of Article Views (full-text article views including HTML views, PDF and ePub downloads, according to the available data) and Abstracts Views on Vision4Press platform.
Data correspond to usage on the plateform after 2015. The current usage metrics is available 48-96 hours after online publication and is updated daily on week days.
Initial download of the metrics may take a while.