Free Access
Fig. 11
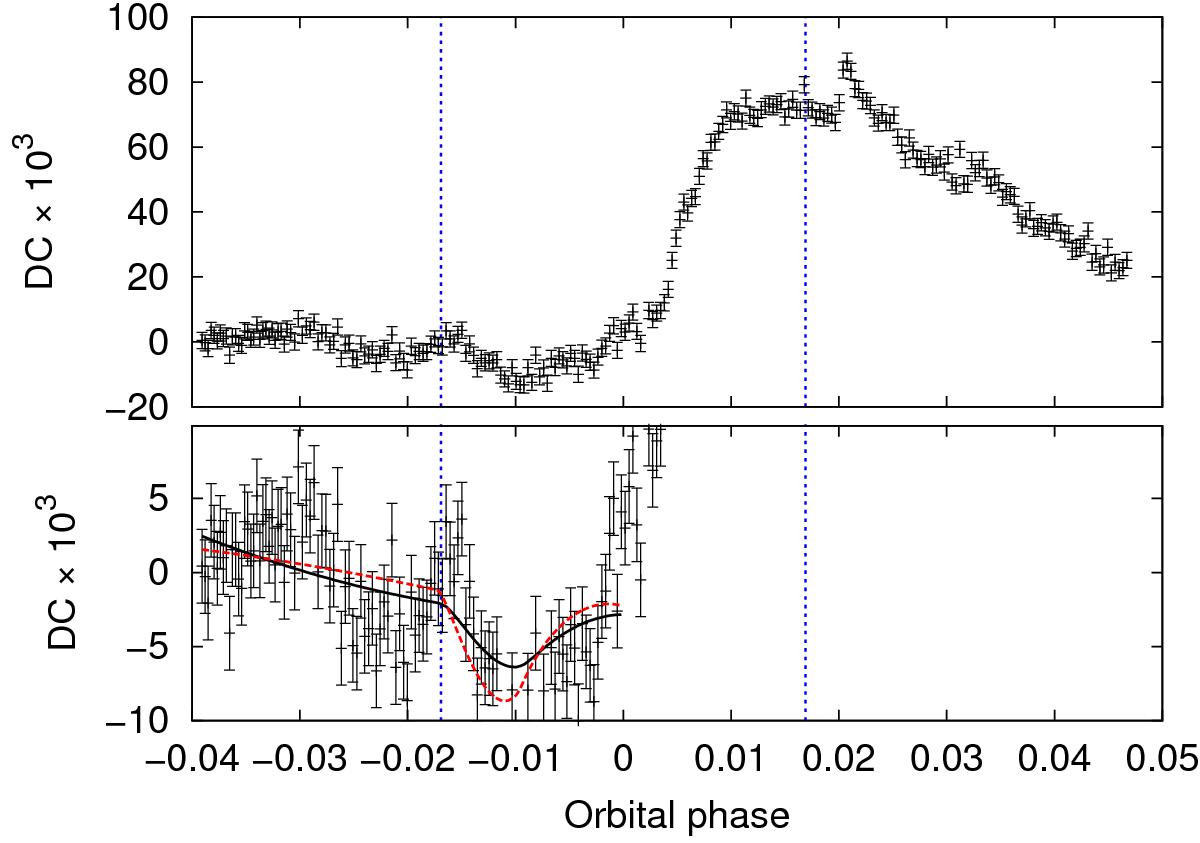
Top: observed DC extracted from the Ca ii H and K line cores. Bottom: close-up of the first half of the observed DC. The solid line shows a photospheric model DC and the dashed line a chromospheric model DC, assuming homogeneous distribution of the Ca ii H and K core emission.
Current usage metrics show cumulative count of Article Views (full-text article views including HTML views, PDF and ePub downloads, according to the available data) and Abstracts Views on Vision4Press platform.
Data correspond to usage on the plateform after 2015. The current usage metrics is available 48-96 hours after online publication and is updated daily on week days.
Initial download of the metrics may take a while.