Fig. 9
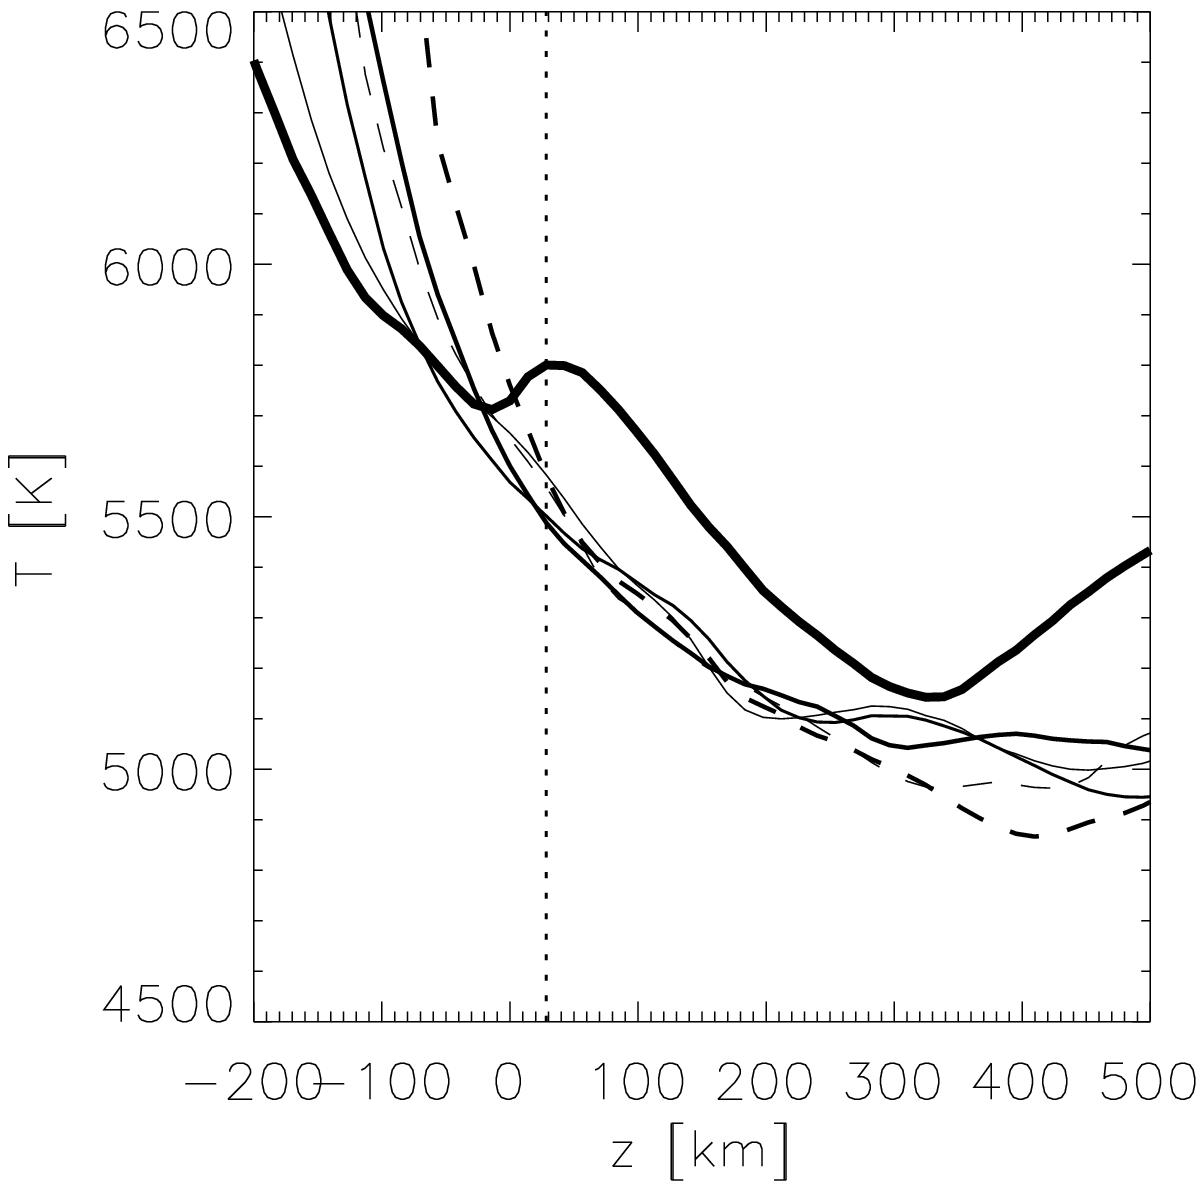
Temperature curves as a function of height in the core of the chosen FT where the 3D NLTE line strengthening is strongest (thick solid line) and at positions in the surroundings of the FT. Other solid lines: temperature curves averaged over the four points in positive and negative x and y direction at a given distance from the FT center. The thickness of the line increases with distance from the FT core. From thinnest to thicker lines (solid): 84 km, 146 km, and, 209 km. Dashed lines: the same as for the solid ones but for the four points in diagonal direction. The two lines lie 118 km (thinner line) and 177 km (thicker line) away. The vertical line indicates the approximate height of formation of the 630.15 nm line core in the core of the FT, where the continuum is formed slightly below z = −200 km.
Current usage metrics show cumulative count of Article Views (full-text article views including HTML views, PDF and ePub downloads, according to the available data) and Abstracts Views on Vision4Press platform.
Data correspond to usage on the plateform after 2015. The current usage metrics is available 48-96 hours after online publication and is updated daily on week days.
Initial download of the metrics may take a while.