Fig. 8
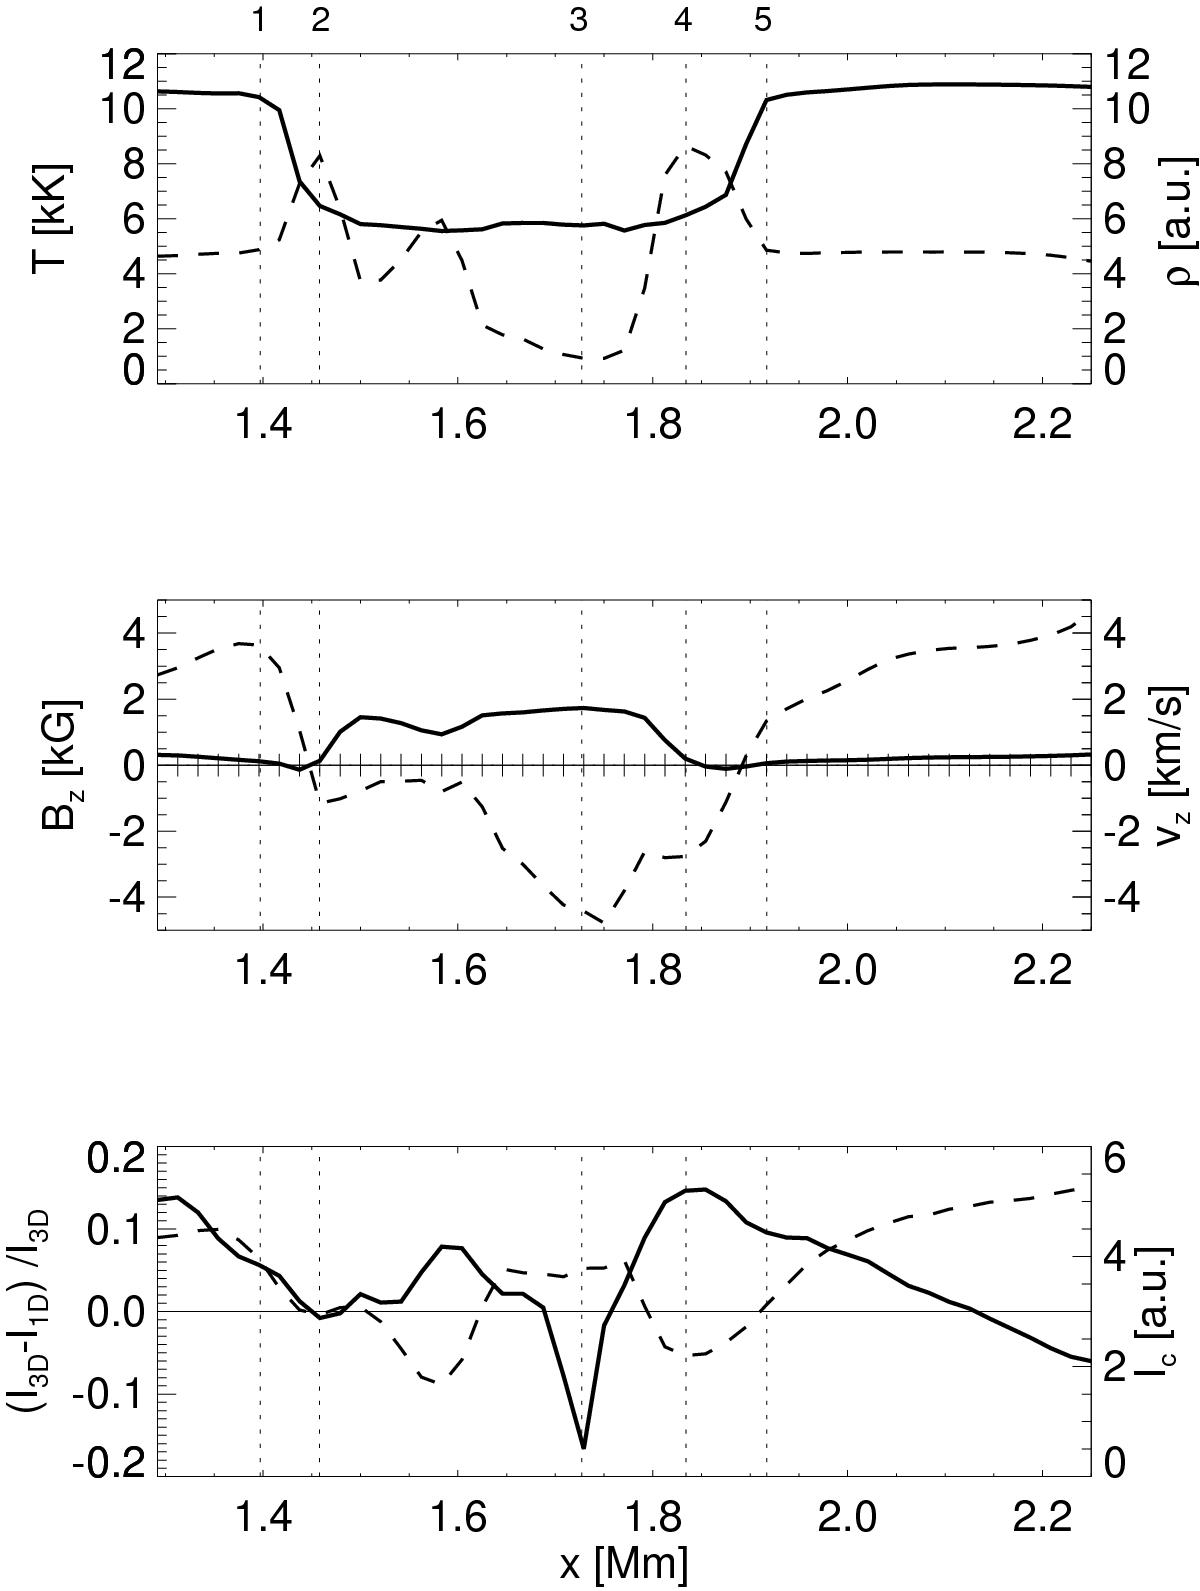
Physical quantities at a fixed geometrical height (z = −42 km) along the same diagonal cut as in Fig. 7. This height corresponds roughly to the line core formation height of the 630.15 nm line in the center of the FT. The axis description of the solid lines is given on the left, that of the dashed lines on the right side. Top panel: temperature (solid) and density (dashed). Middle panel: magnetic field (solid) and vertical velocity (dashed, positive values correspond to upflows). The tick marks at the horizontal zero line correspond to the individual voxels in the model atmosphere. Bottom panel: NLTE intensity ratio (I3D − I1D) /I3D (solid) representing 3D NLTE line weakening (positive values) or strengthening (negative values) and continuum intensity (dashed). Vertical lines (dotted) represent positions (numbered on top of the uppermost panel) along the cut that are discussed in the main text. As in Fig. 7, the values of the x-axis correspond to x-axis of the simulation and not to the length along the diagonal cut.
Current usage metrics show cumulative count of Article Views (full-text article views including HTML views, PDF and ePub downloads, according to the available data) and Abstracts Views on Vision4Press platform.
Data correspond to usage on the plateform after 2015. The current usage metrics is available 48-96 hours after online publication and is updated daily on week days.
Initial download of the metrics may take a while.