Fig. 7
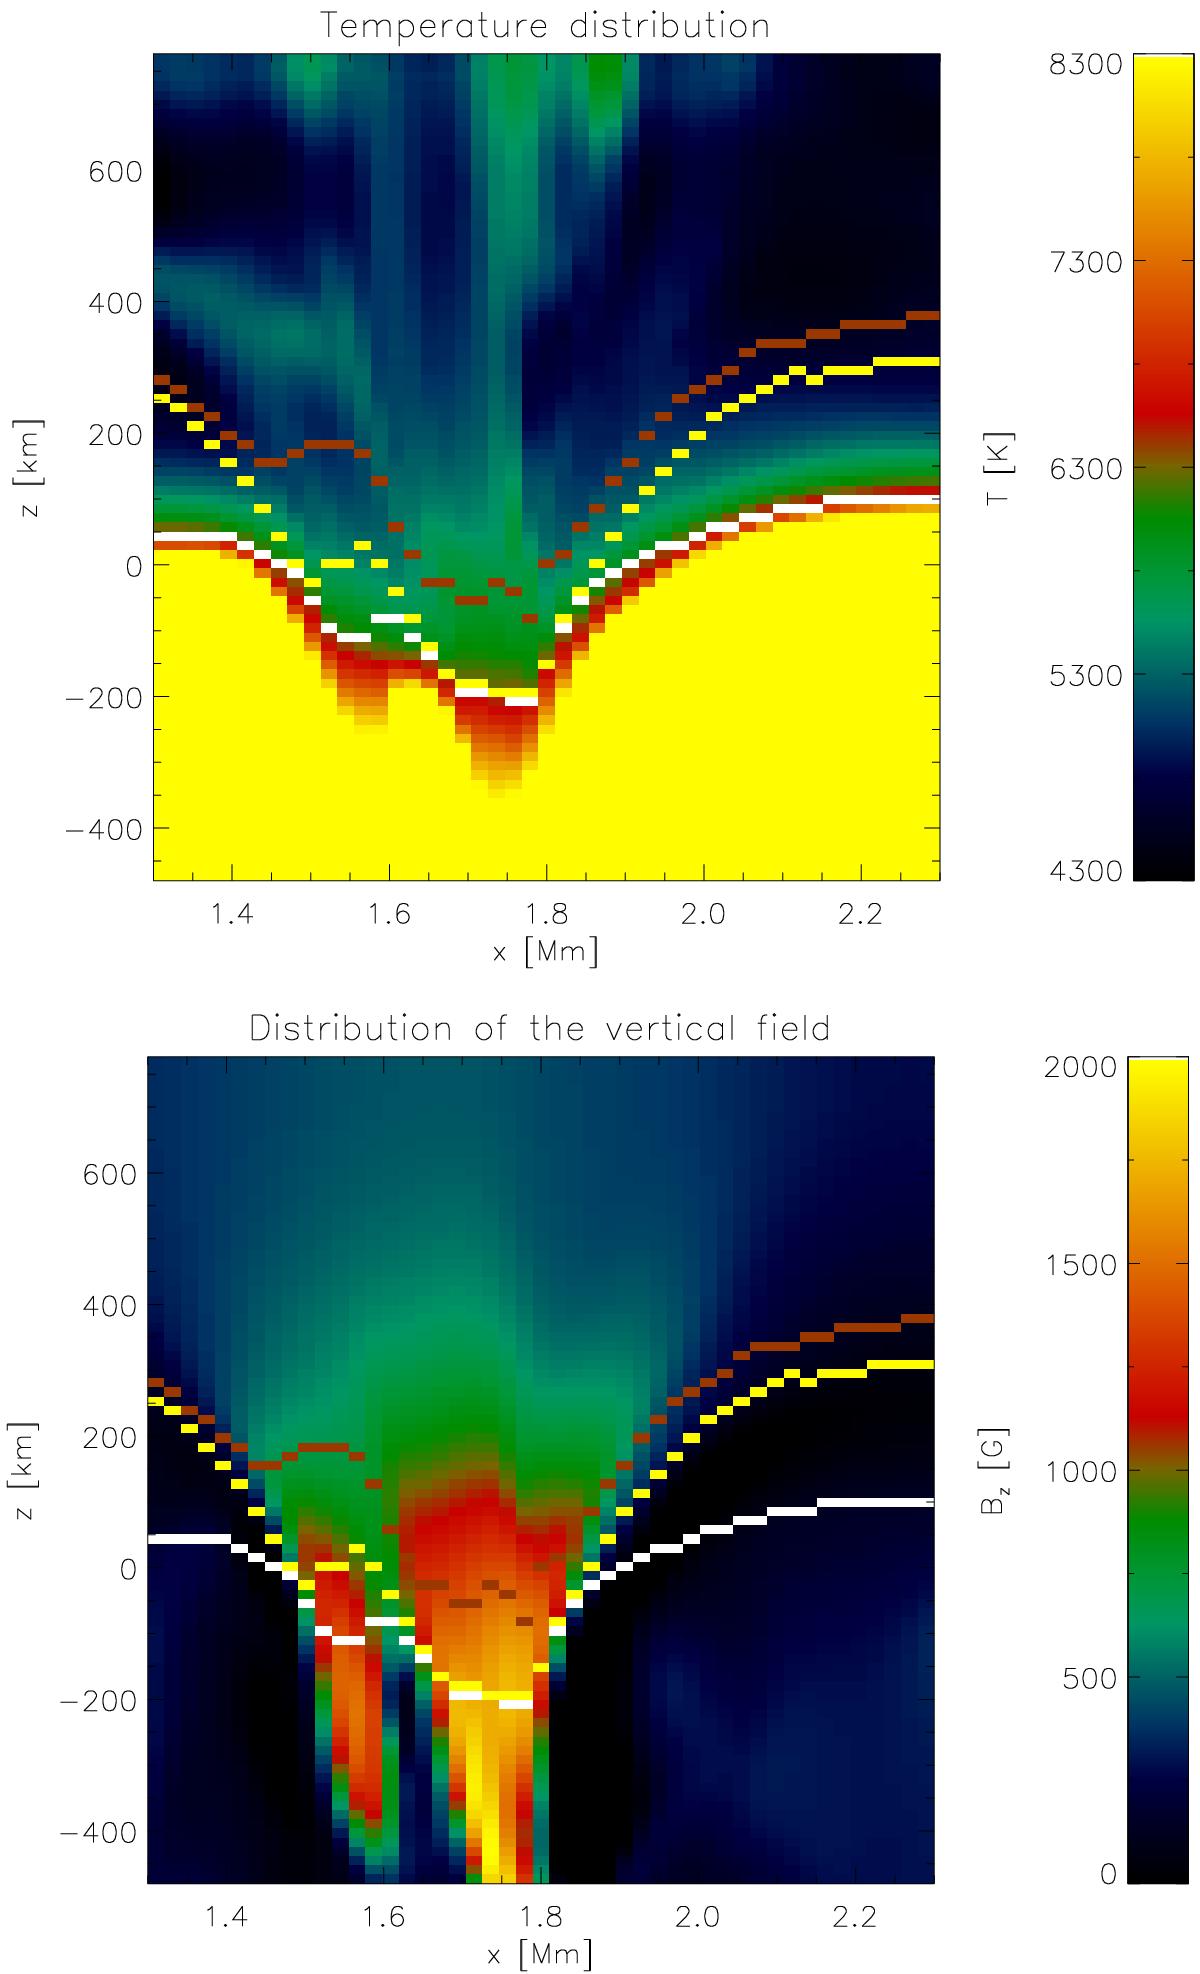
Temperature distribution (upper panel) and vertical magnetic field Bz (lower panel) along the cut through the FT indicated in Fig. 2 (diagonal line). The colored dots indicate several τ = 1 levels (white: continuum near 525 nm; yellow: 525.02 nm line core; brown: 630.15 nm line core). We note that the values of the x-axis correspond to those of the x-axis of the simulation and not to the length along the diagonal cut. I.e., the true distance between two points along the (diagonal) cut is longer by a factor ![]() .
.
Current usage metrics show cumulative count of Article Views (full-text article views including HTML views, PDF and ePub downloads, according to the available data) and Abstracts Views on Vision4Press platform.
Data correspond to usage on the plateform after 2015. The current usage metrics is available 48-96 hours after online publication and is updated daily on week days.
Initial download of the metrics may take a while.