Fig. 4
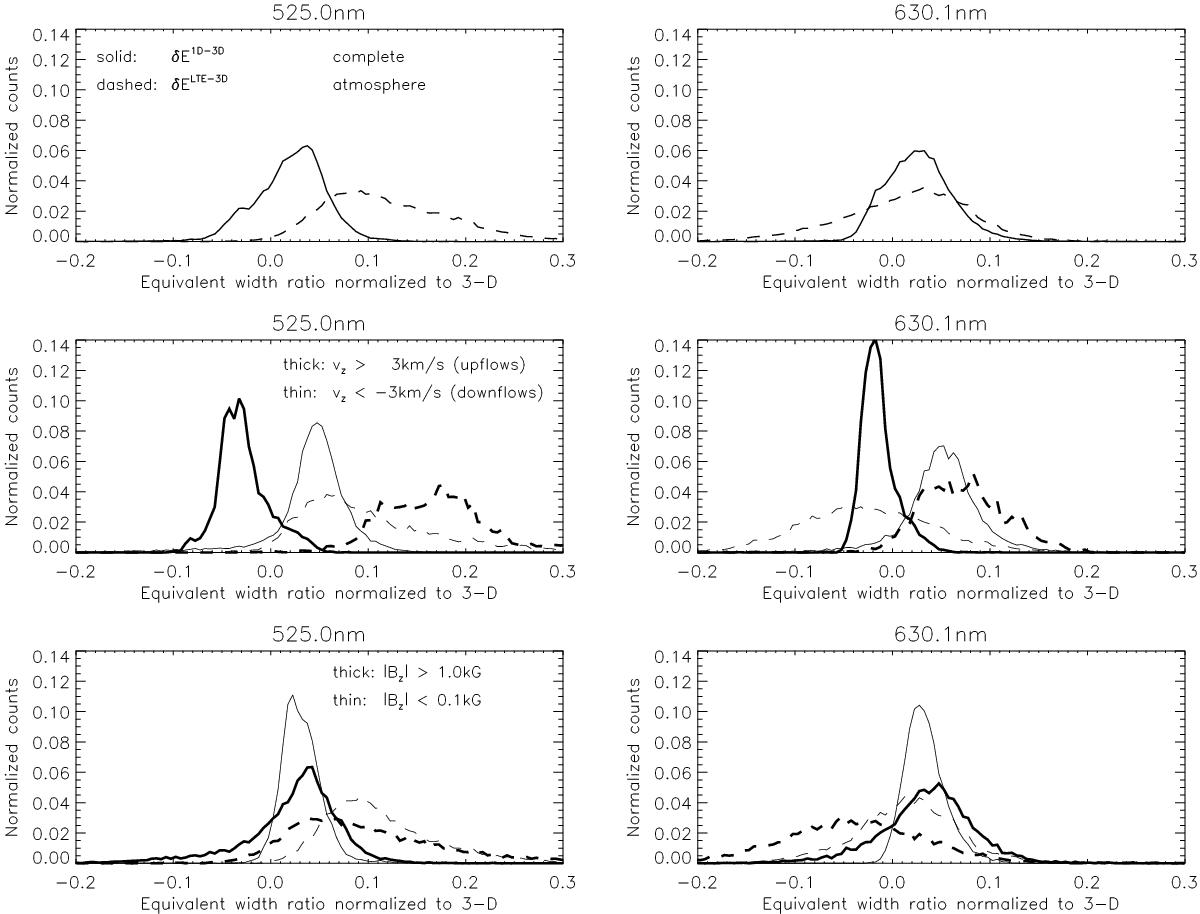
Distribution of the δELTE−3D (dashed lines) and δE1D−3D (solid lines) values for the 525.02 nm (left panels) and the 630.15 nm line (right panels). The three vertically arranged panels contain the histograms for different spatial selections. Top panels: full atmosphere; Middle panels: areas with strong upflows (thin lines) and downflows (thick lines), the spatial points were selected if the vertical velocity at τc = 1 was higher than 3 km s-1 in either direction. Bottom panels: the same as in the middle panels, but with the thick line now representing points at which the magnetic field strength | Bz | is stronger than 1 kG, and the thin line field strengths below 100 G. The number of selected spatial points in the middle and bottom panels amounts to approximately 10% to 20% of the whole atmosphere for each selection.
Current usage metrics show cumulative count of Article Views (full-text article views including HTML views, PDF and ePub downloads, according to the available data) and Abstracts Views on Vision4Press platform.
Data correspond to usage on the plateform after 2015. The current usage metrics is available 48-96 hours after online publication and is updated daily on week days.
Initial download of the metrics may take a while.