Fig. 5
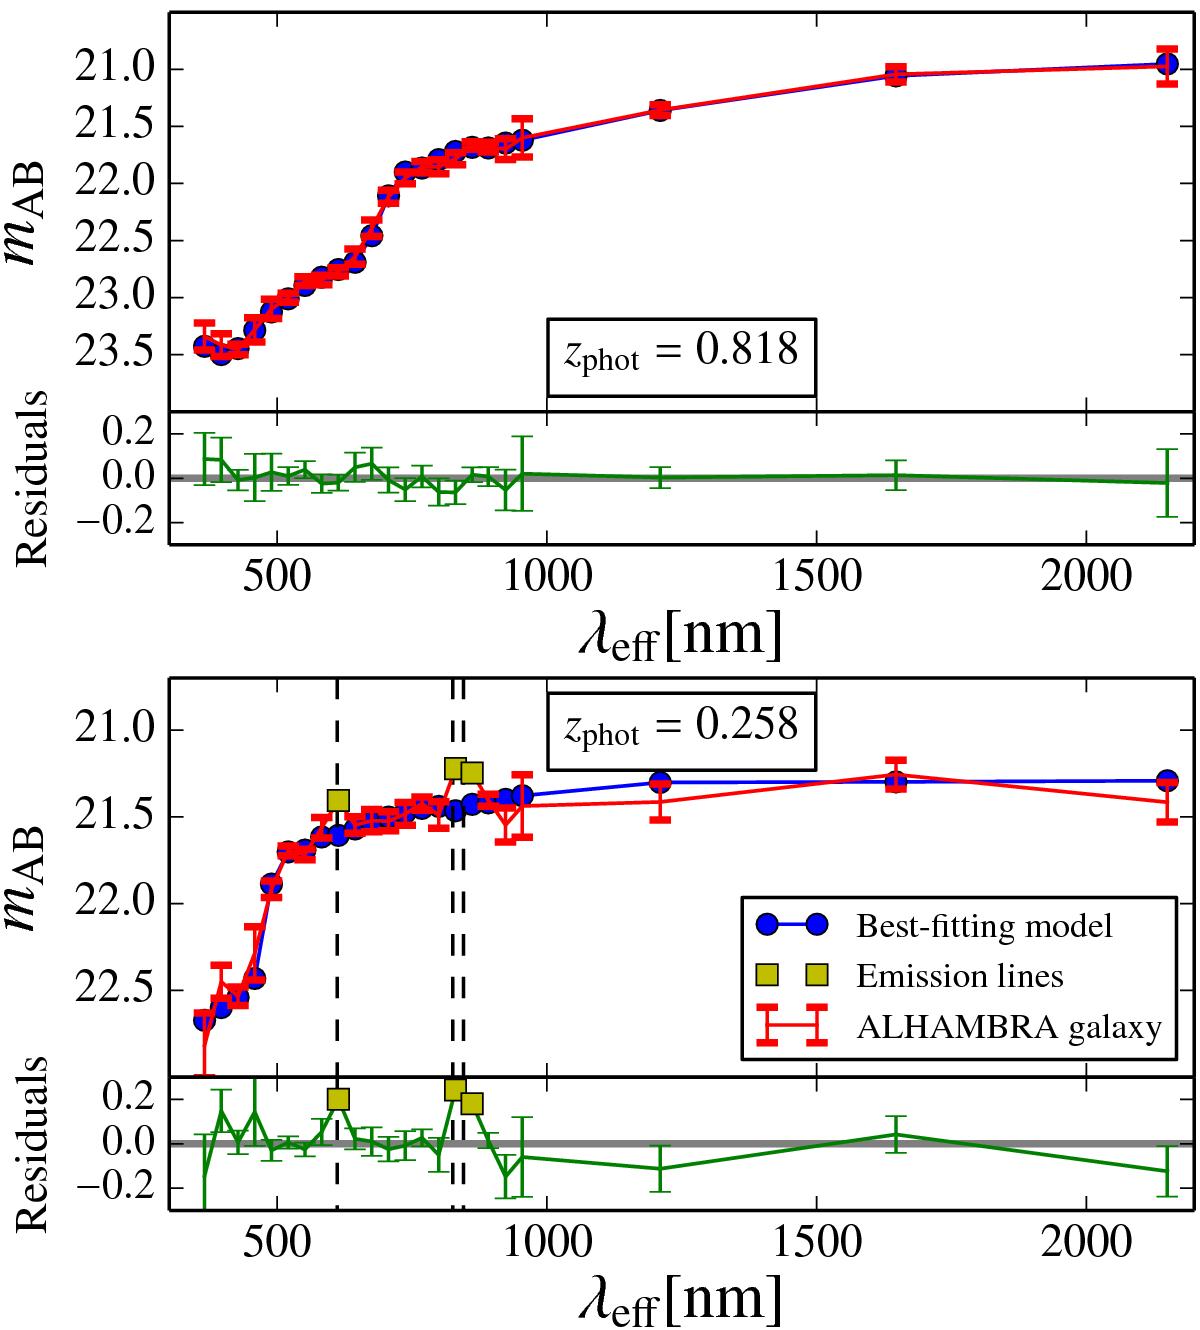
Spectral fitting examples for galaxies from the ALHAMBRA survey using MUFFIT and the MIUSCAT SSP models. The galaxy photo-spectra and their errors are given in red, whereas the best-fitting models are given in blue. The top panel corresponds to a quiescent galaxy for which no emission lines are detected. The bottom panel illustrates the case of a star-forming galaxy for which MUFFIT detects three bands affected by emission lines, in yellow. The dashed black lines indicate the wavelengths for H β, H α, and [S ii]. Photometric redshifts are given in the insets in the figure.
Current usage metrics show cumulative count of Article Views (full-text article views including HTML views, PDF and ePub downloads, according to the available data) and Abstracts Views on Vision4Press platform.
Data correspond to usage on the plateform after 2015. The current usage metrics is available 48-96 hours after online publication and is updated daily on week days.
Initial download of the metrics may take a while.