Fig. 17
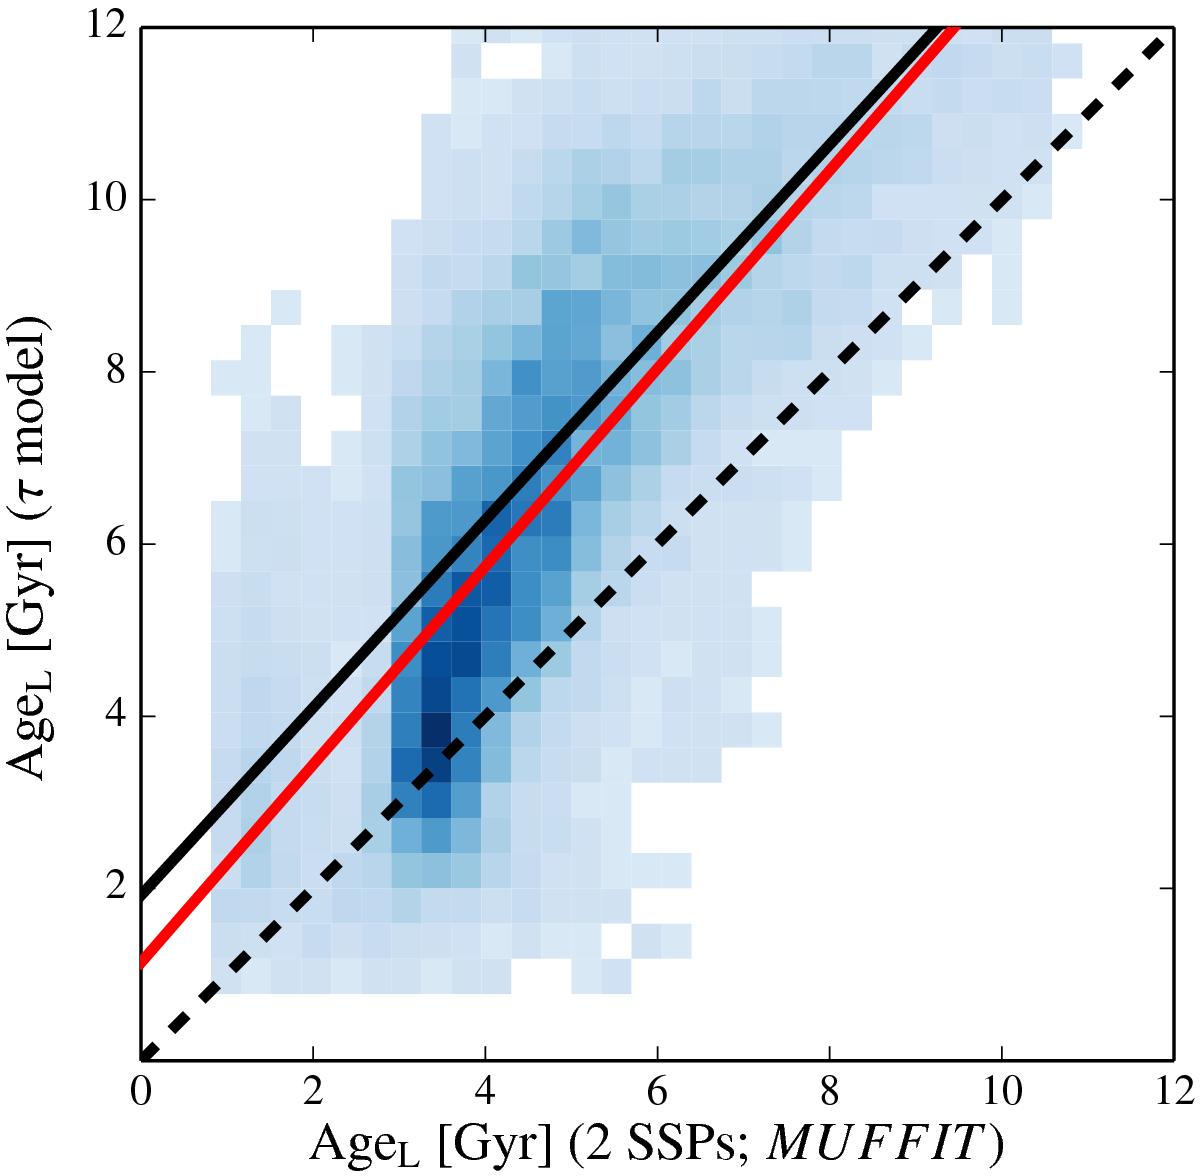
Comparison between the luminosity-weighted ages of a subset of RS τ-models from SSAG and the ones derived by MUFFIT for the same models employing a mixture of 2 SSPs. The dashed black line represents the one-to-one relationship, while the red line is the simple linear regression of the data points. The solid black line illustrates the fit between the ages provided by G05 and the ones provided by MUFFIT using ALHAMBRA data (see Fig. 16b).
Current usage metrics show cumulative count of Article Views (full-text article views including HTML views, PDF and ePub downloads, according to the available data) and Abstracts Views on Vision4Press platform.
Data correspond to usage on the plateform after 2015. The current usage metrics is available 48-96 hours after online publication and is updated daily on week days.
Initial download of the metrics may take a while.