Free Access
Fig. 14
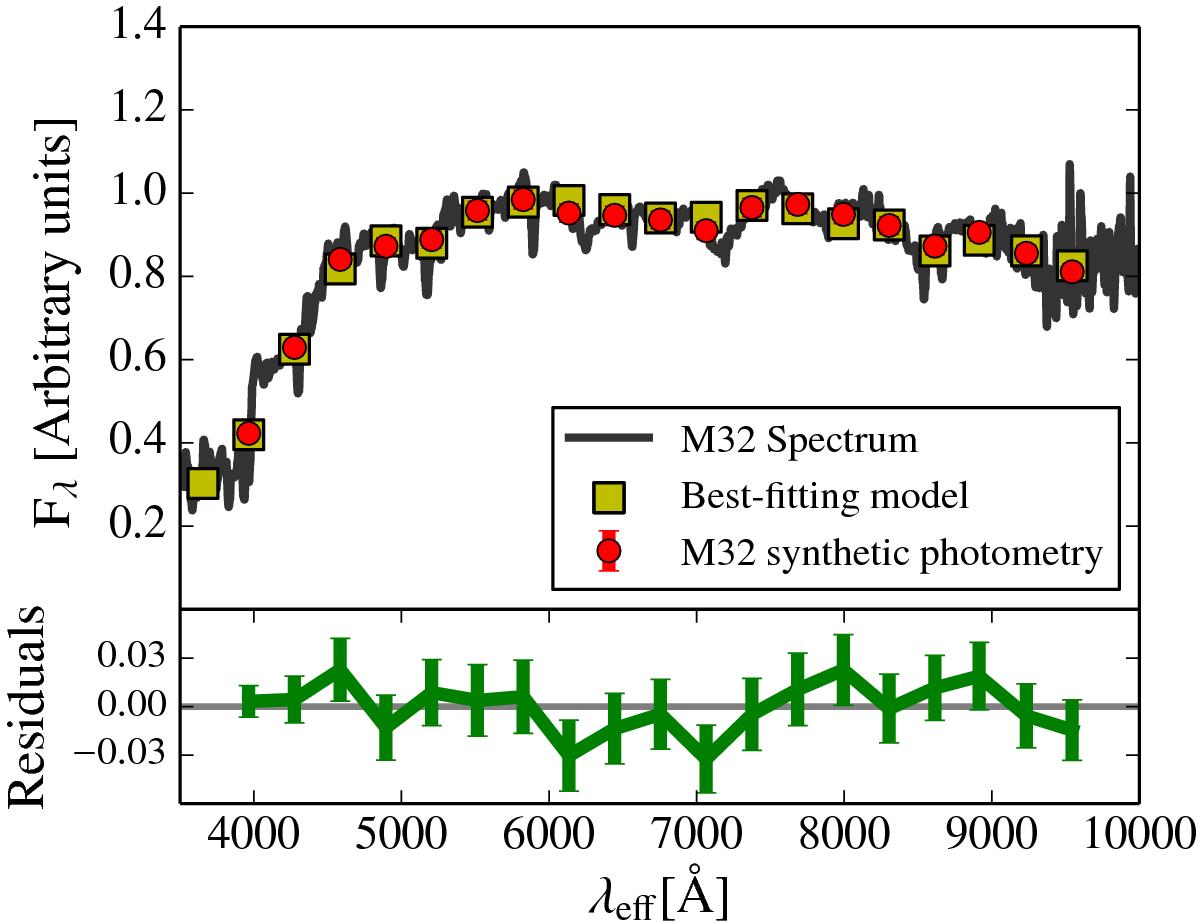
Spectral fitting of M32 as seen by ALHAMBRA using the MIUSCAT SSP SEDs as template models with the analysis explained above. The synthetic photometry of M32 is plotted in red, whereas the best fit of a mixture of two SSPs to the spectrum of M32 is plotted in yellow. The bottom pannel shows the residuals of the best fit.
Current usage metrics show cumulative count of Article Views (full-text article views including HTML views, PDF and ePub downloads, according to the available data) and Abstracts Views on Vision4Press platform.
Data correspond to usage on the plateform after 2015. The current usage metrics is available 48-96 hours after online publication and is updated daily on week days.
Initial download of the metrics may take a while.