Fig. 10
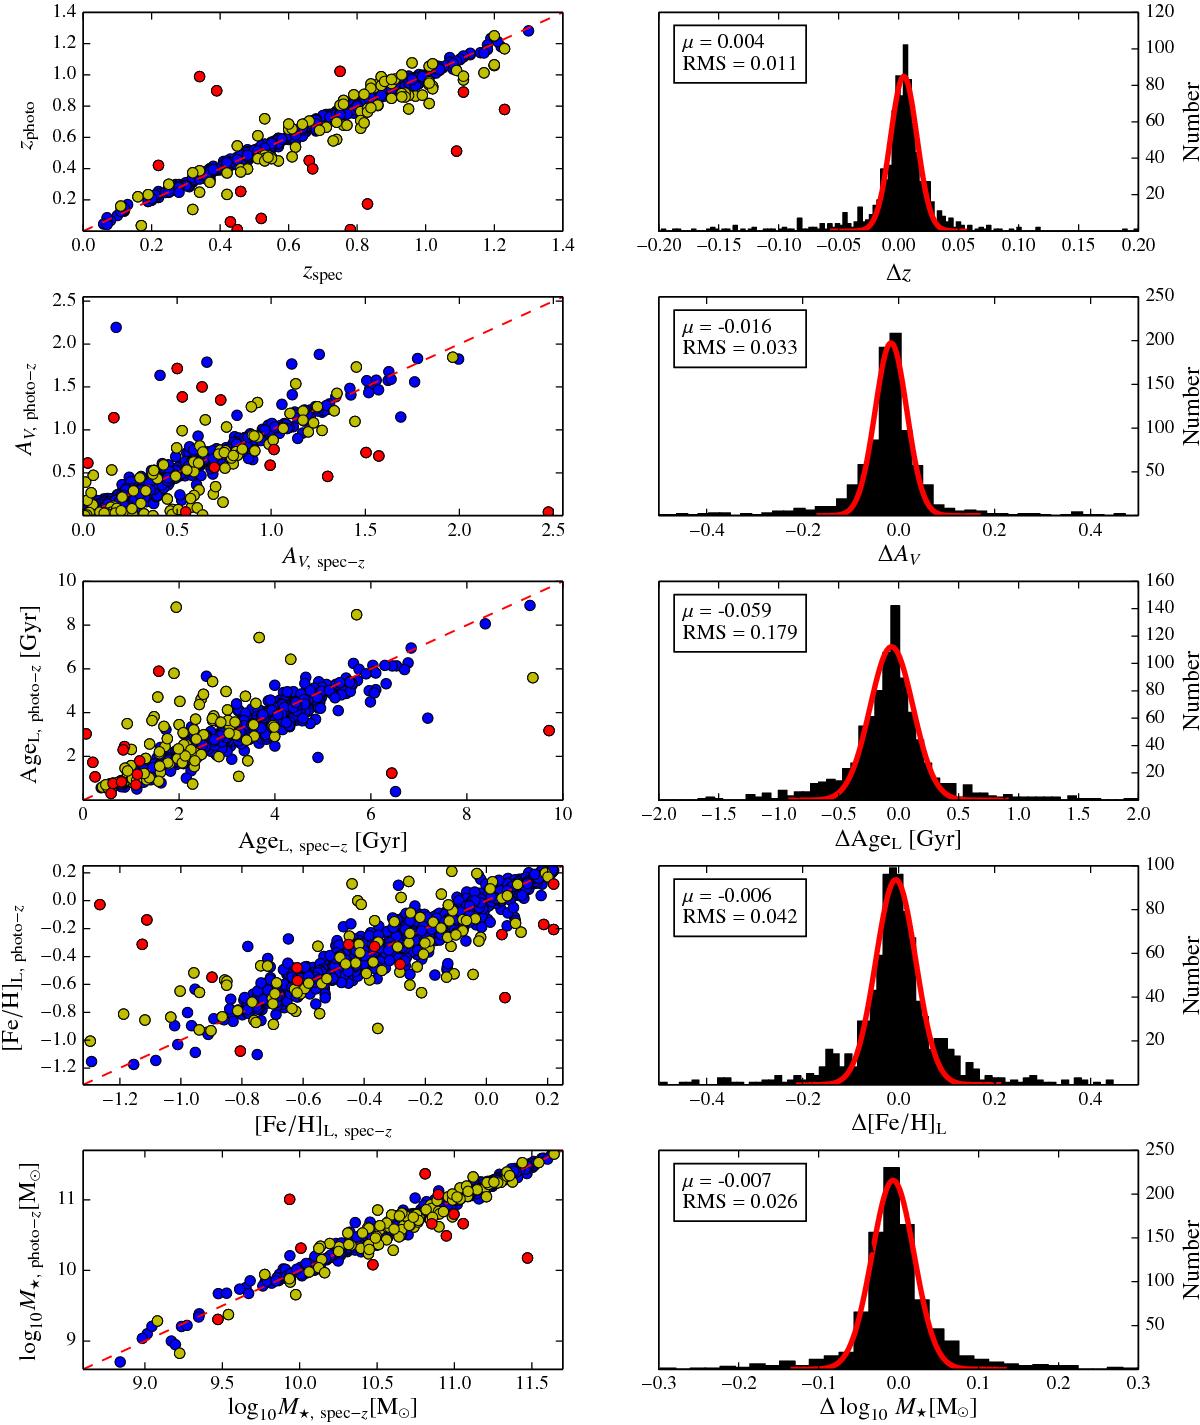
Impact of a redshift uncertainty ~1% on the stellar population parameters. On the left, we present the comparative one-to-one of the obtained parameters without any constrain in the photo z (Y-axis) versus the results forcing the redshift to its spectroscopic value (X-axis). The dashed red line represents the one-to-one relationship. Red, yellow, and blue dots are galaxies for which | zspec − zphot | > 0.2, 0.044 ≤ | zphot − zspec | < 0.2, and | zphot − zspec | < 0.044, respectively. On the right, we have the histograms of the differences between the obtained results with and without the spectroscopic constraint. The solid red line is the best fit of the distribution to a Gaussian function, and the boxes show both Gaussian mean and rms. From top to bottom, we show redshift, extinction, age, metallicity, and stellar mass.
Current usage metrics show cumulative count of Article Views (full-text article views including HTML views, PDF and ePub downloads, according to the available data) and Abstracts Views on Vision4Press platform.
Data correspond to usage on the plateform after 2015. The current usage metrics is available 48-96 hours after online publication and is updated daily on week days.
Initial download of the metrics may take a while.