Fig. 12
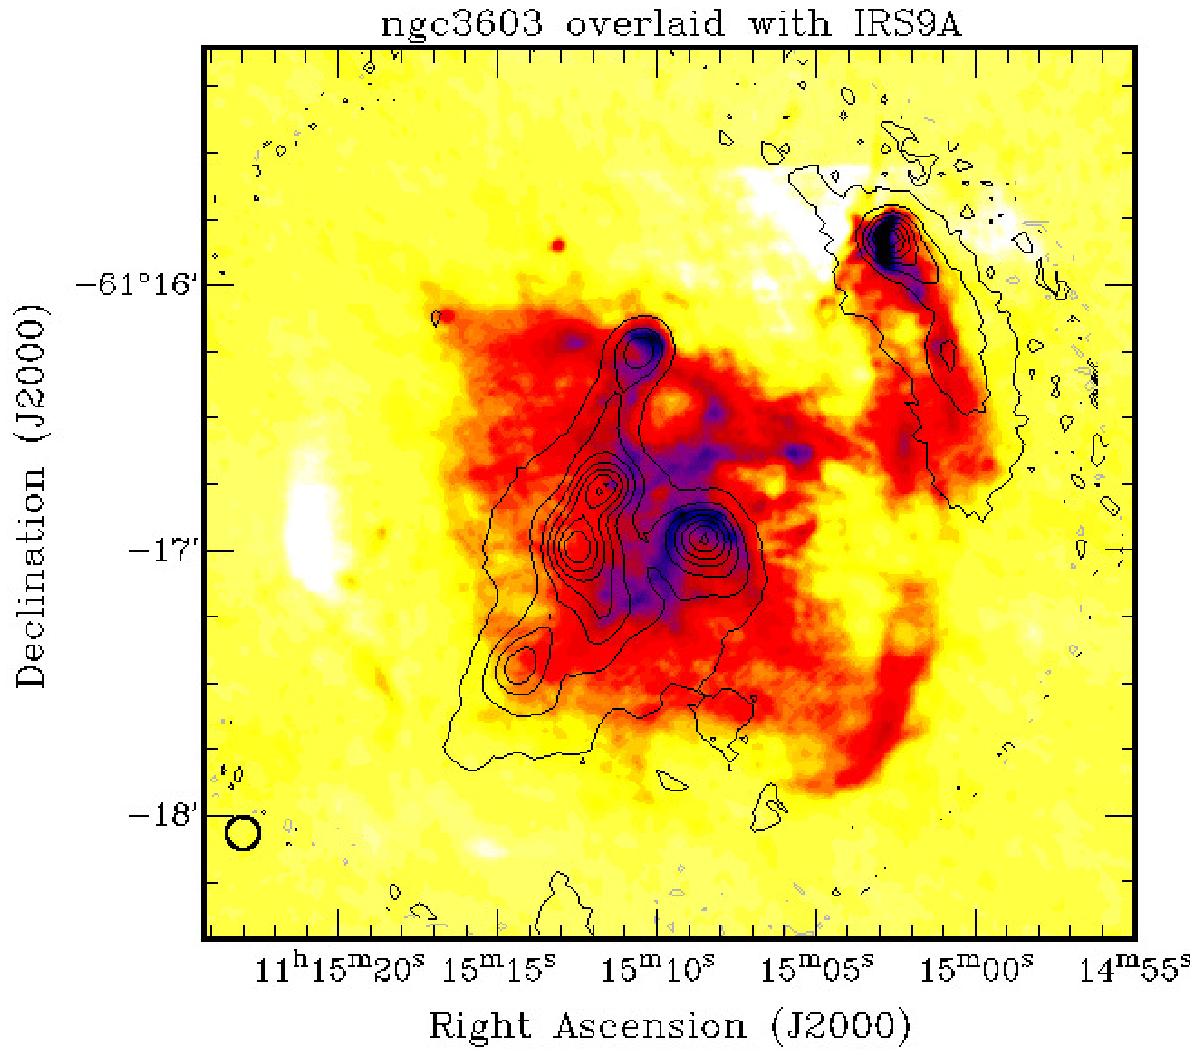
Overlay of SABOCA contours on a 5 GHz image of the H ii region obtained from ATCA data by Mücke et al. (2002). The blue image regions correspond to the largest 5 GHz fluxes, while the yellow denotes the faintest 5 GHz emission. The contour levels are at 87%, 73%, 60%, 46%, 33%, 19%, and 06% of the maximum. The ATCA beam is 2′′, and the SABOCA beam is 7.8′′ and is shown in the lower left corner.
Current usage metrics show cumulative count of Article Views (full-text article views including HTML views, PDF and ePub downloads, according to the available data) and Abstracts Views on Vision4Press platform.
Data correspond to usage on the plateform after 2015. The current usage metrics is available 48-96 hours after online publication and is updated daily on week days.
Initial download of the metrics may take a while.