Fig. 11
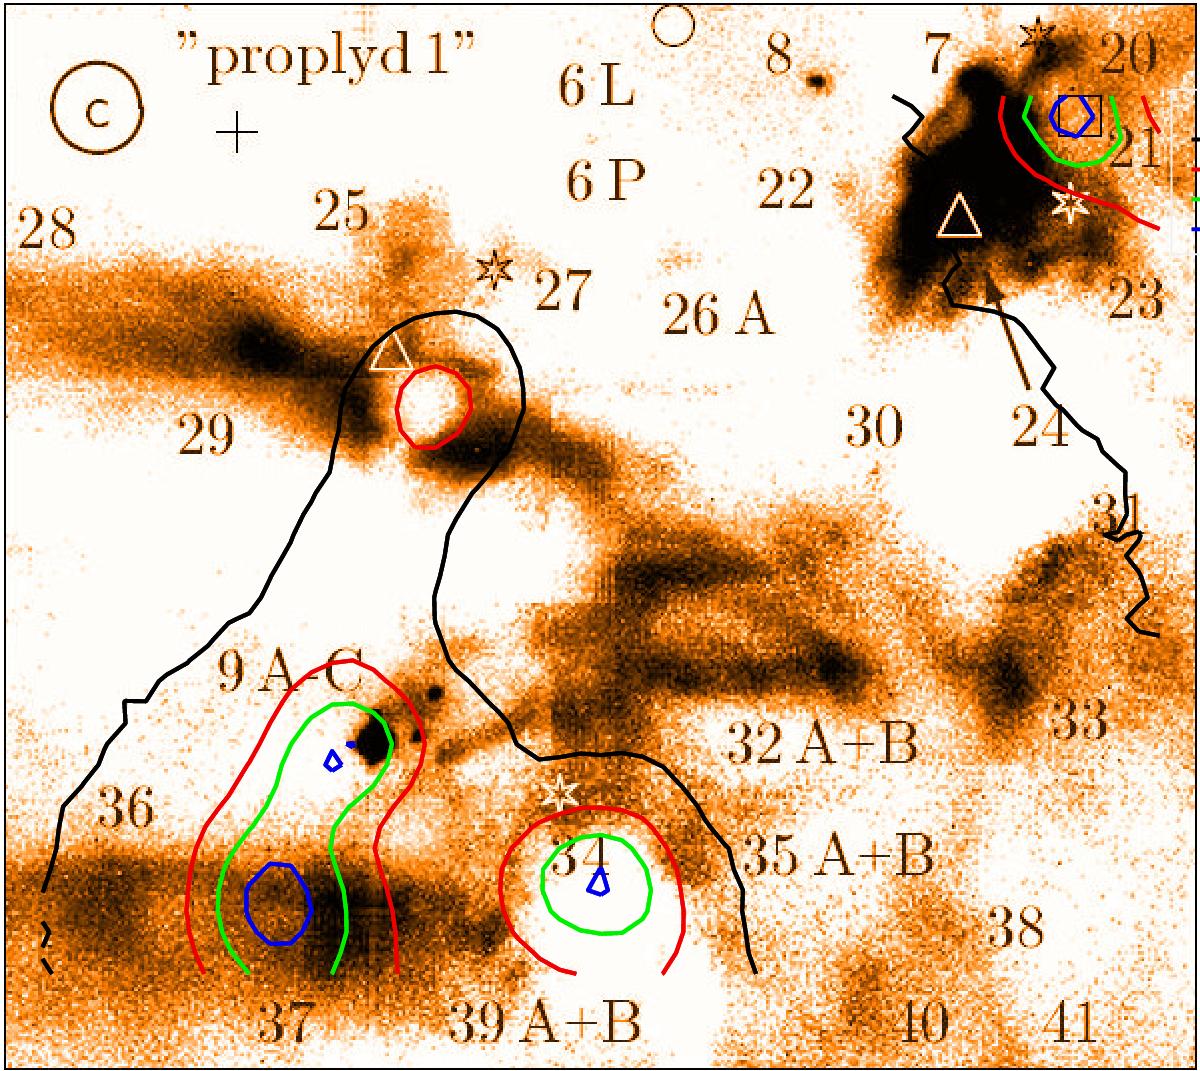
TIMMI2 11.9 μm image (Fig. 4c of Nürnberger & Stanke 2003) with overlaid contours of the SABOCA map. The image size is 95′′ by 110′′. The labeling is from Nürnberger & Stanke (2003) and denotes the position of the cluster with an open circle, the positions of IR sources from Frogel et al. (1977) with asterisks, while all other labels refer to sources given by Nürnberger & Stanke (2003). The photo-center of the SABOCA source closest to IRS 9A is shifted by about 3′′ to the east-southeast. Component S8 of the SABOCA image coincides quite well with a maser source indicated by the square, according to Nürnberger & Stanke (2003).
Current usage metrics show cumulative count of Article Views (full-text article views including HTML views, PDF and ePub downloads, according to the available data) and Abstracts Views on Vision4Press platform.
Data correspond to usage on the plateform after 2015. The current usage metrics is available 48-96 hours after online publication and is updated daily on week days.
Initial download of the metrics may take a while.