Fig. 3
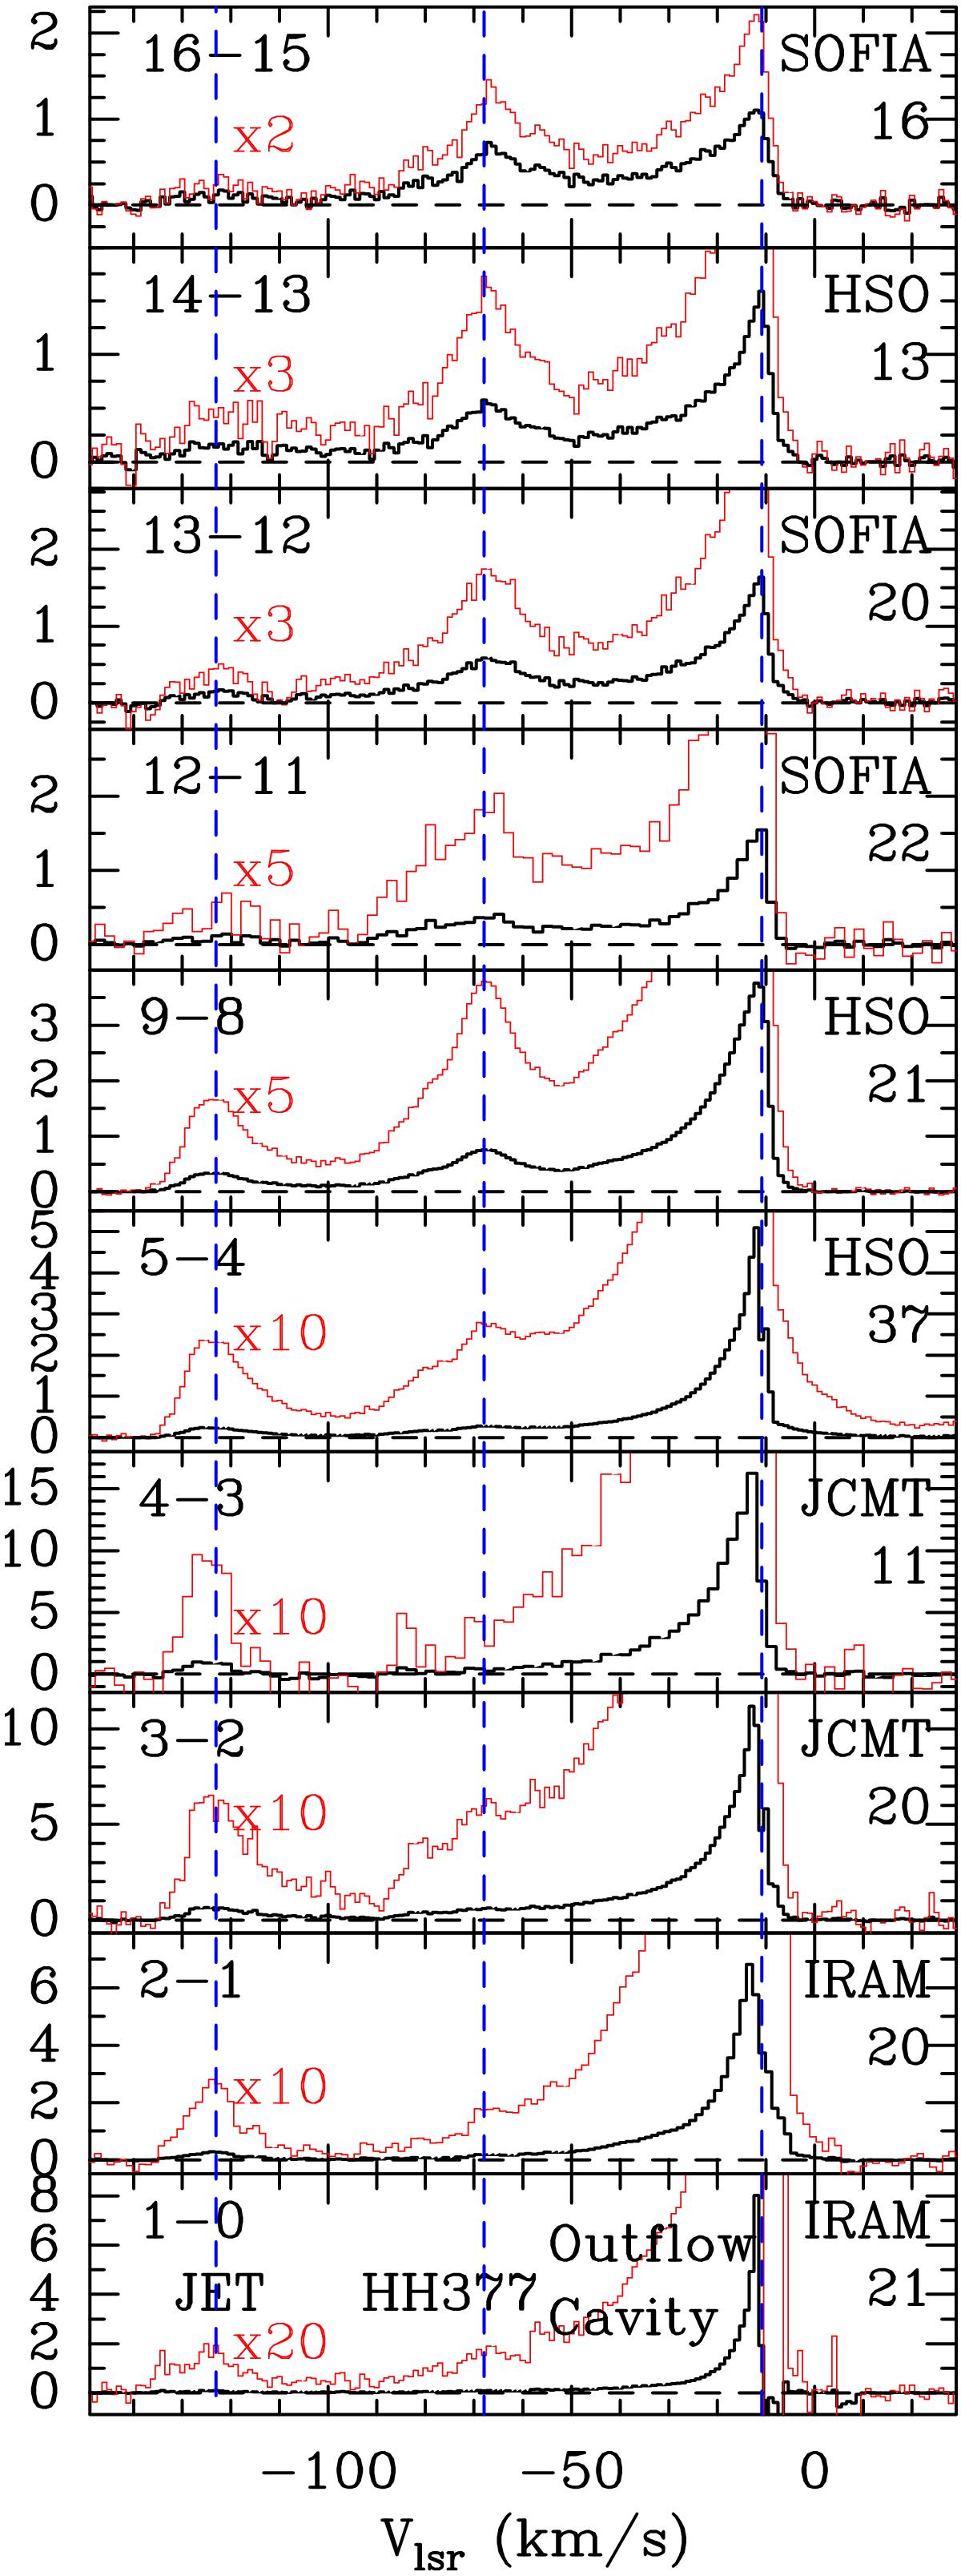
Montage of all the CO transitions observed towards HH377. Line profiles are drawn in thick black. Spectra enhanced with a magnifying factor in order to enhance the high-velocity emission are drawn in thin red. Fluxes are expressed in units of antenna temperature ![]() , corrected for atmospheric absorption (for ground-based observations). The ambient cloud velocity (vlsr = −10.9 km s-1), the peak velocity of the protostellar jet (v = −125 km s-1), and the bowshock HH377 (v = −68 km s-1) are marked by dashed blue lines. On the right hand side of each panel we have indicated the observatory and the HPBW in arcsec.
, corrected for atmospheric absorption (for ground-based observations). The ambient cloud velocity (vlsr = −10.9 km s-1), the peak velocity of the protostellar jet (v = −125 km s-1), and the bowshock HH377 (v = −68 km s-1) are marked by dashed blue lines. On the right hand side of each panel we have indicated the observatory and the HPBW in arcsec.
Current usage metrics show cumulative count of Article Views (full-text article views including HTML views, PDF and ePub downloads, according to the available data) and Abstracts Views on Vision4Press platform.
Data correspond to usage on the plateform after 2015. The current usage metrics is available 48-96 hours after online publication and is updated daily on week days.
Initial download of the metrics may take a while.