Fig. 2
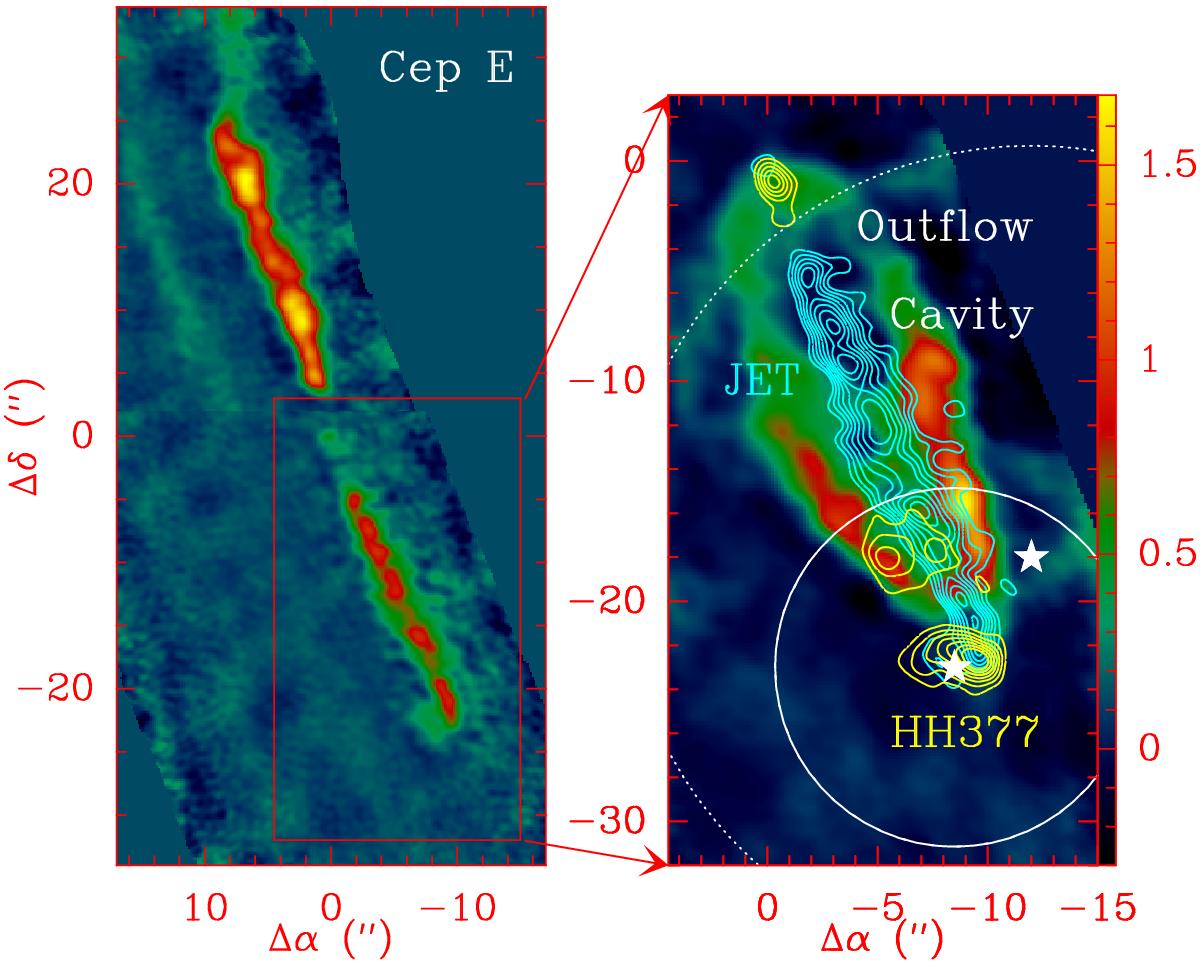
Left: CO J = 2–1 velocity-integrated emission of the protostellar jet observed with the PdBI. The emission is integrated between −135 and −110 km s-1 and between +40 and +80 km s-1 towards the southern and northern lobes, respectively. Right: the three kinematic components in the southern lobe of the Cepheus E outflow as seen by the PdBI at 1″ resolution in the CO J = 2–1 line: a) outflow cavity emission between −15 and −12 km s-1 (color); b) HH377 bowshock emission between −77 and −64 km s-1 (yellow contours); c) jet emission between −135 and −110 km s-1 (blue contours). First contour and contour interval are 20% and 10% of the peak intensity, respectively. The white stars mark the location of the positions observed with SOFIA (−8.5″, −23″) and Herschel (HSO), IRAM, and JCMT (−12″, −18″). The beam width at half-power of SOFIA in the CO J = 16–15 and of HIFI in the J = 5–4 are drawn by a solid and a dotted circle, respectively.
Current usage metrics show cumulative count of Article Views (full-text article views including HTML views, PDF and ePub downloads, according to the available data) and Abstracts Views on Vision4Press platform.
Data correspond to usage on the plateform after 2015. The current usage metrics is available 48-96 hours after online publication and is updated daily on week days.
Initial download of the metrics may take a while.