Fig. 7
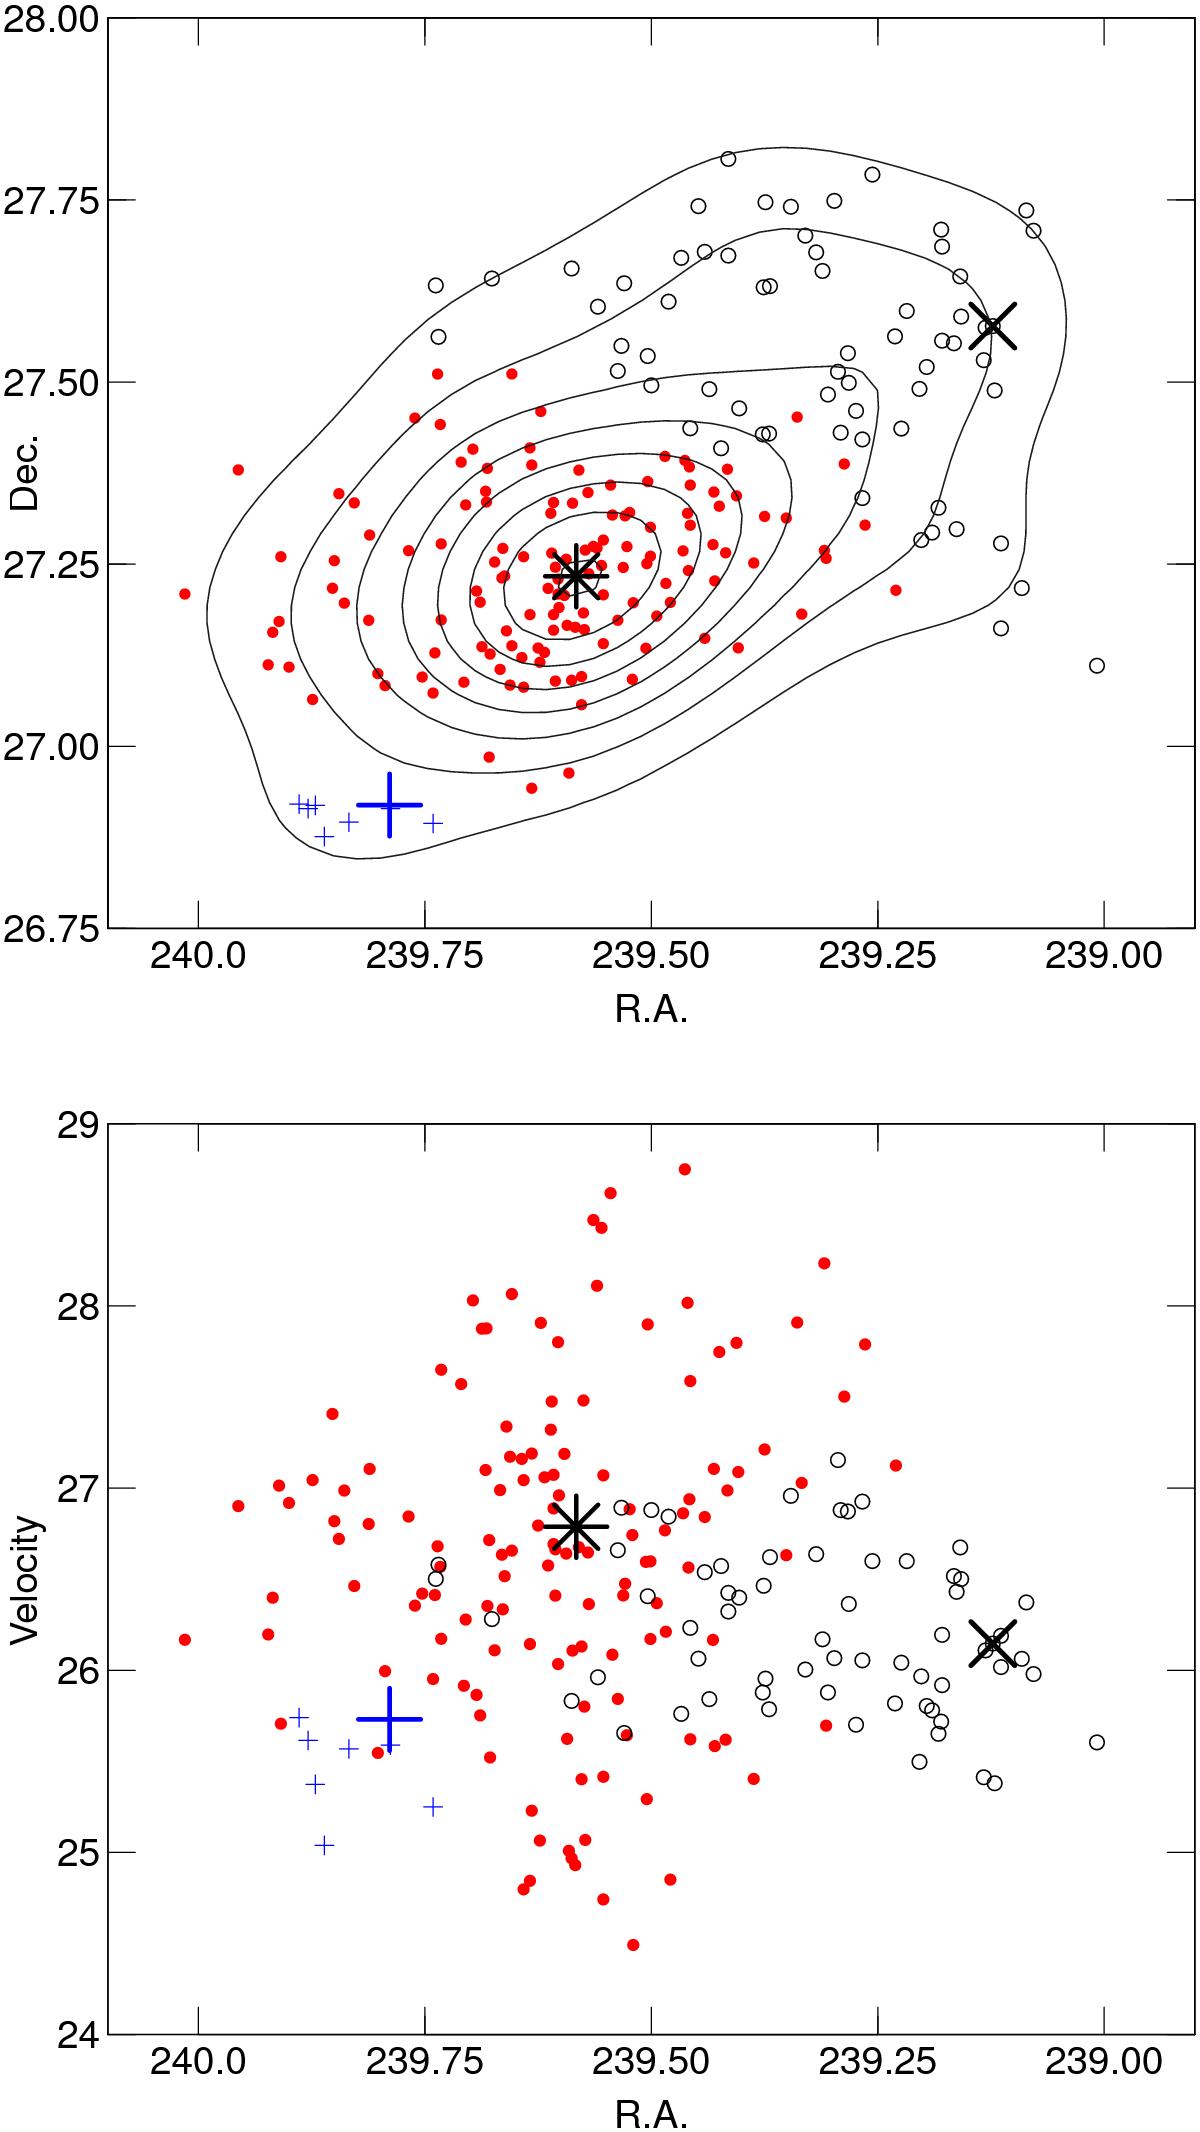
Multimodal group Gr3070 (Abell cluster A2142, No. 2 in Table 2). Upper panel: sky distribution of galaxies in the group, lower panel: RA vs. velocity (in 103 km s-1) plot; symbols show different galaxies belonging to different components as found by Mclust. The star marks the location of the main galaxy in the first component, the X shows the location of the brightest galaxy in the second component, and the cross shows the location of the brightest galaxy in the third component. Contours show the surface density distribution of galaxies in the whole cluster.
Current usage metrics show cumulative count of Article Views (full-text article views including HTML views, PDF and ePub downloads, according to the available data) and Abstracts Views on Vision4Press platform.
Data correspond to usage on the plateform after 2015. The current usage metrics is available 48-96 hours after online publication and is updated daily on week days.
Initial download of the metrics may take a while.