Fig. 3
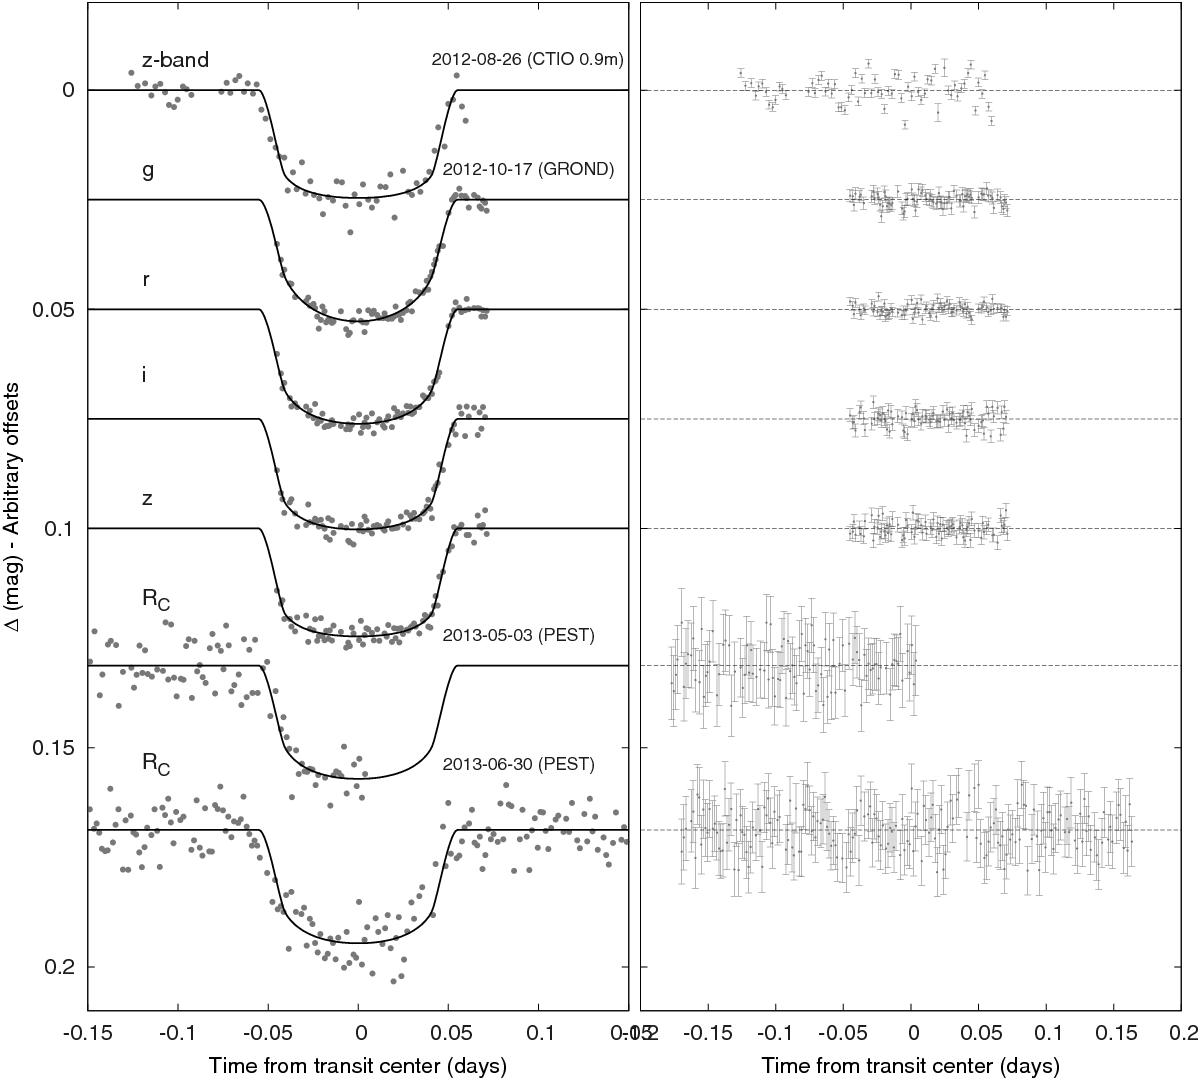
Left panel: unbinned transit light curves for HATS-13. The light curves have been corrected for quadratic trends in time fitted simultaneously with the transit model. The dates of the events, filters, and instruments used are indicated. Light curves following the first are displaced vertically for clarity. Our best fit from the global modelling described in Sect. 3.3 is shown by the solid lines. Right panel: residuals from the fits are displayed in the same order as the left curves. The error bars represent the photon and background shot noise, plus the readout noise.
Current usage metrics show cumulative count of Article Views (full-text article views including HTML views, PDF and ePub downloads, according to the available data) and Abstracts Views on Vision4Press platform.
Data correspond to usage on the plateform after 2015. The current usage metrics is available 48-96 hours after online publication and is updated daily on week days.
Initial download of the metrics may take a while.