Fig. 2
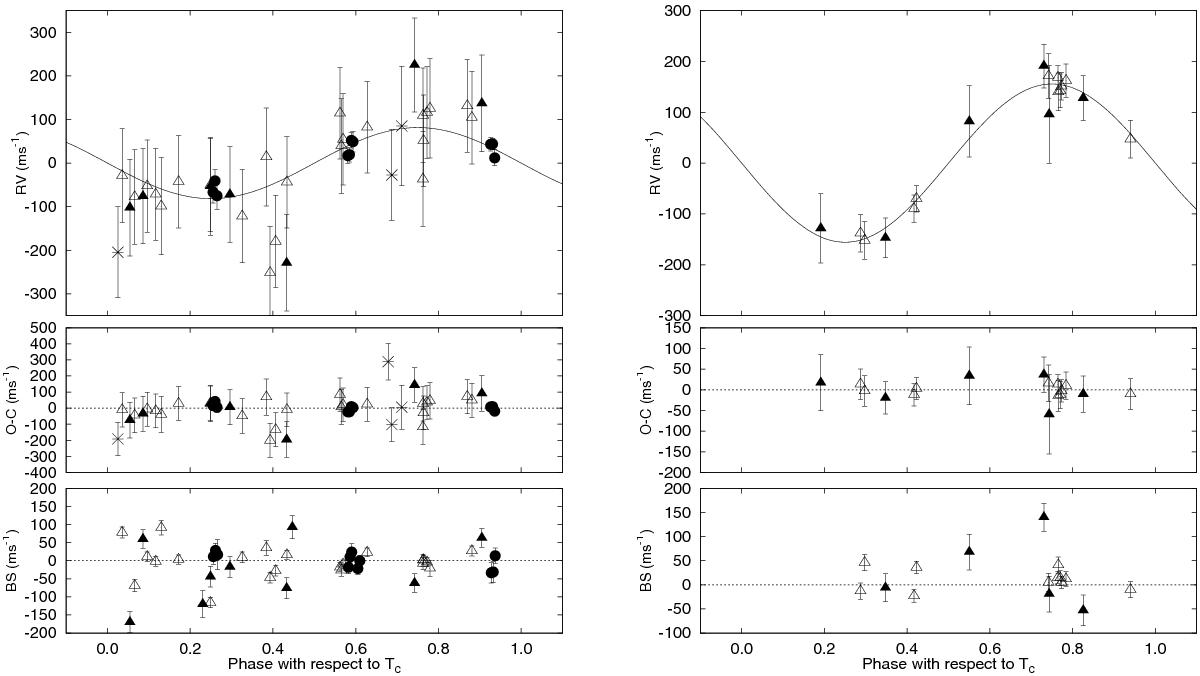
Phased high-precision RV measurements for HATS-13 (left), and HATS-14 (right) from HDS (filled circles), FEROS (open triangles), Coralie (filled triangles), and CYCLOPS (stars). In each case we show three panels. The top panel shows the phased measurements together with our best-fit model (see Table 4) for each system. Zero-phase corresponds to the time of mid-transit. The center-of-mass velocity has been subtracted. The second panel shows the velocity O–C residuals from the best fit. The error bars include the jitter terms listed in Table 4 added in quadrature to the formal errors for each instrument. The third panel shows the bisector spans (BS) with the mean value subtracted. Note the different vertical scales of the panels.
Current usage metrics show cumulative count of Article Views (full-text article views including HTML views, PDF and ePub downloads, according to the available data) and Abstracts Views on Vision4Press platform.
Data correspond to usage on the plateform after 2015. The current usage metrics is available 48-96 hours after online publication and is updated daily on week days.
Initial download of the metrics may take a while.