Free Access
Fig. 3
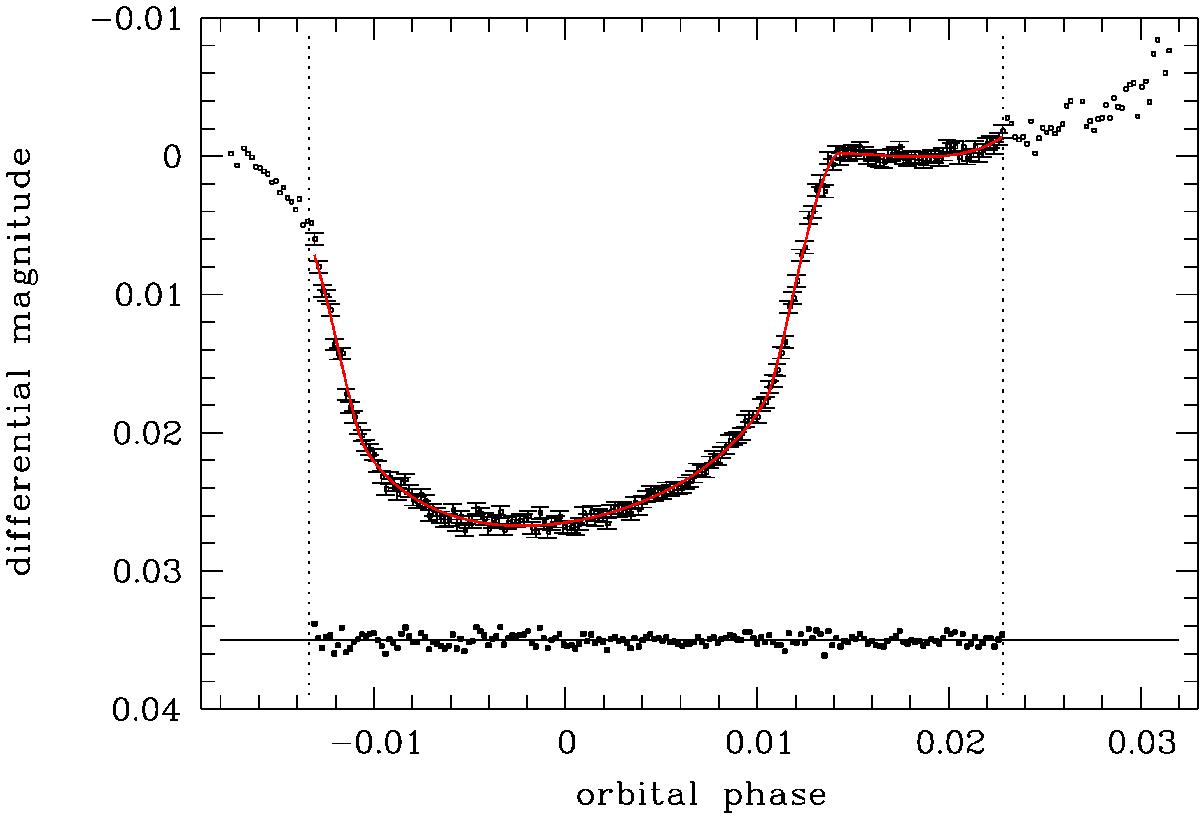
Transit light-curve integrated over the entire spectral range (white light). The vertical dashed lines confine the data that were used for the analysis, see text for details. The red solid line shows the best-fit model, the residuals are presented at the bottom.
Current usage metrics show cumulative count of Article Views (full-text article views including HTML views, PDF and ePub downloads, according to the available data) and Abstracts Views on Vision4Press platform.
Data correspond to usage on the plateform after 2015. The current usage metrics is available 48-96 hours after online publication and is updated daily on week days.
Initial download of the metrics may take a while.