Fig. 3
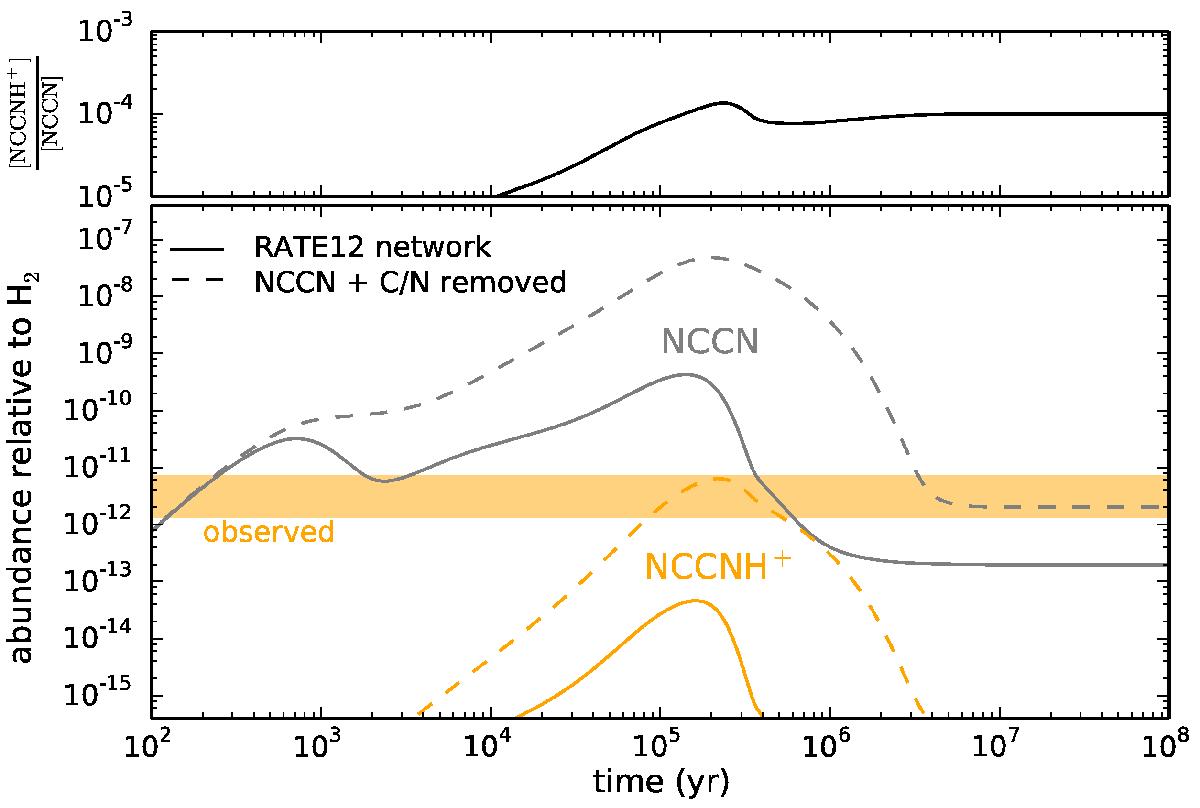
Calculated abundances of NCCNH+ and NCCN as a function of time using the UMIST RATE12 chemical network (solid lines) and after removing the reactions of destruction of NCCN with C and N atoms (dashed lines), in both cases adopting ζ = 1.3 × 10⁻¹⁷ s-1. The range of abundances of NCCNH+ observed in TMC-1 and L483 is also indicated. The calculated abundance ratio [NCCNH+]/[NCCN] is shown in the upper panel as a function of time.
Current usage metrics show cumulative count of Article Views (full-text article views including HTML views, PDF and ePub downloads, according to the available data) and Abstracts Views on Vision4Press platform.
Data correspond to usage on the plateform after 2015. The current usage metrics is available 48-96 hours after online publication and is updated daily on week days.
Initial download of the metrics may take a while.