Fig. A.6
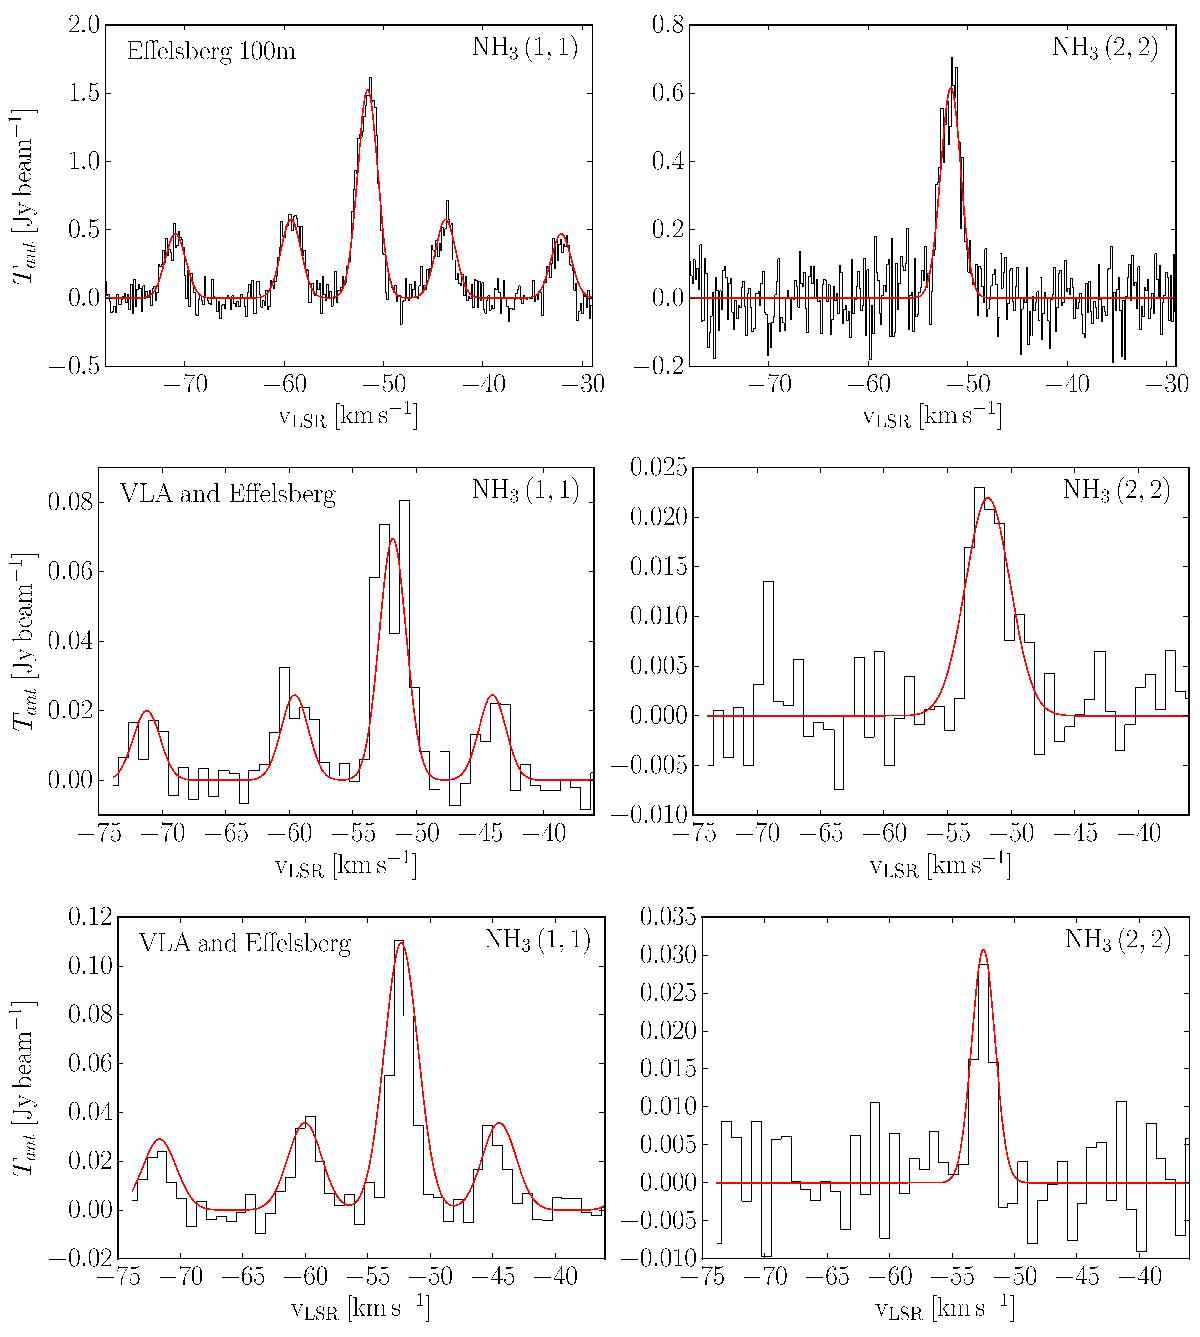
NH3 spectra of ISOSS23053. Left-hand side: NH3(1, 1) spectra, and right-hand side: NH3(2, 2) spectra. Top two panels: Effelsberg 100 m observations, central panels: combined VLA and Effelsberg 100 m spectra at the position p1, and bottom panels: combined VLA and Effelsberg 100 m spectra at the position p2. The red line corresponds to the fit. Since we do not observe the hyperfine structure of the NH3(2, 2) transition, we show a Gaussian fit to the main component. The fit parameters and coordinates of the spectra are given in Table A.1.
Current usage metrics show cumulative count of Article Views (full-text article views including HTML views, PDF and ePub downloads, according to the available data) and Abstracts Views on Vision4Press platform.
Data correspond to usage on the plateform after 2015. The current usage metrics is available 48-96 hours after online publication and is updated daily on week days.
Initial download of the metrics may take a while.