Fig. 2
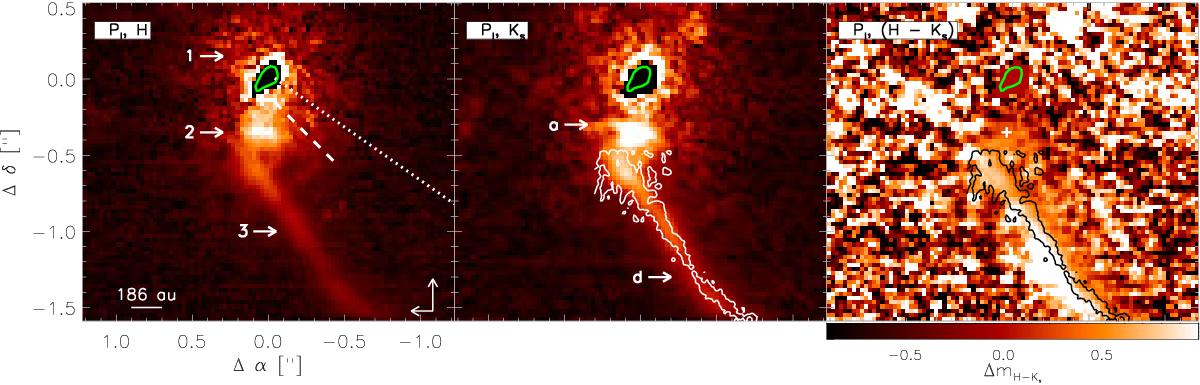
Right and center: PI images at the H and Ks bands. Green contours indicate the position of the two stars. The two images are plotted in the same scale, using square root scaling. The pixels falling in the non-linear regime are set to zero. Left: the dotted and dashed lines indicate the position of large and micro jets, respectively (Whelan et al. 2010). Arrows “1”, “2”, and “3” indicate the polarized halo, the bright clump, and the sharp extended feature, respectively. Center: Arrows “a” and “d” show an artifact and a local decrement in polarized flux. The white line contours the Keck J-band image presented in Millan-Gabet & Monnier (2002). Right: relative polarized color computed as [H]−[Ks]. The white cross indicates the brightest point of feature “2” at the Ks band.
Current usage metrics show cumulative count of Article Views (full-text article views including HTML views, PDF and ePub downloads, according to the available data) and Abstracts Views on Vision4Press platform.
Data correspond to usage on the plateform after 2015. The current usage metrics is available 48-96 hours after online publication and is updated daily on week days.
Initial download of the metrics may take a while.