Fig. 3
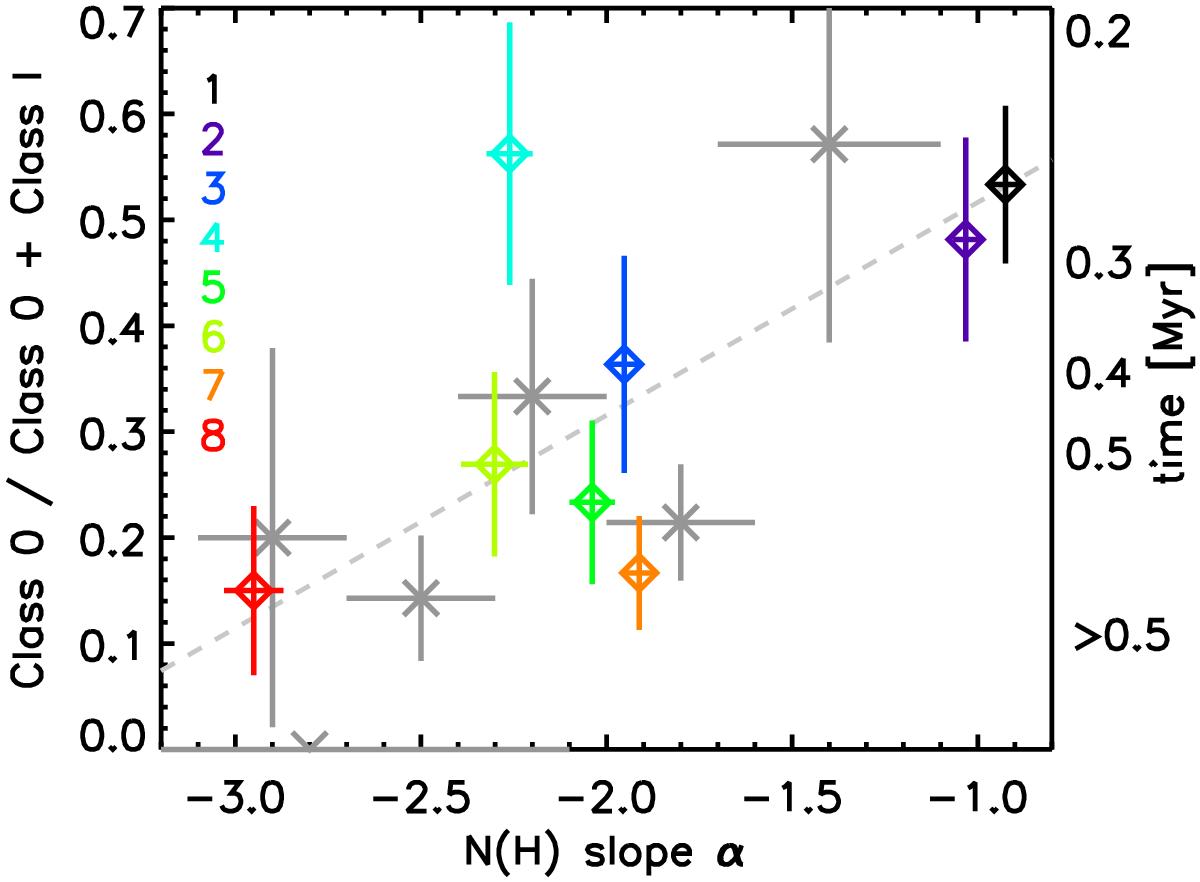
Correlation between the power-law index of the N-PDF and Class 0 fraction across Orion A regions. The Class 0 fraction can be related to a timescale, as indicated, assuming a constant SFR (see text). Gray ×-symbols are the data from Perseus from Sadavoy (2013), Sadavoy et al. (2014), and Sadavoy (priv. comm., 2015). The dashed gray curve shows the linear fit to the data, which have a correlation coefficient of 0.7.
Current usage metrics show cumulative count of Article Views (full-text article views including HTML views, PDF and ePub downloads, according to the available data) and Abstracts Views on Vision4Press platform.
Data correspond to usage on the plateform after 2015. The current usage metrics is available 48-96 hours after online publication and is updated daily on week days.
Initial download of the metrics may take a while.