Fig. 2
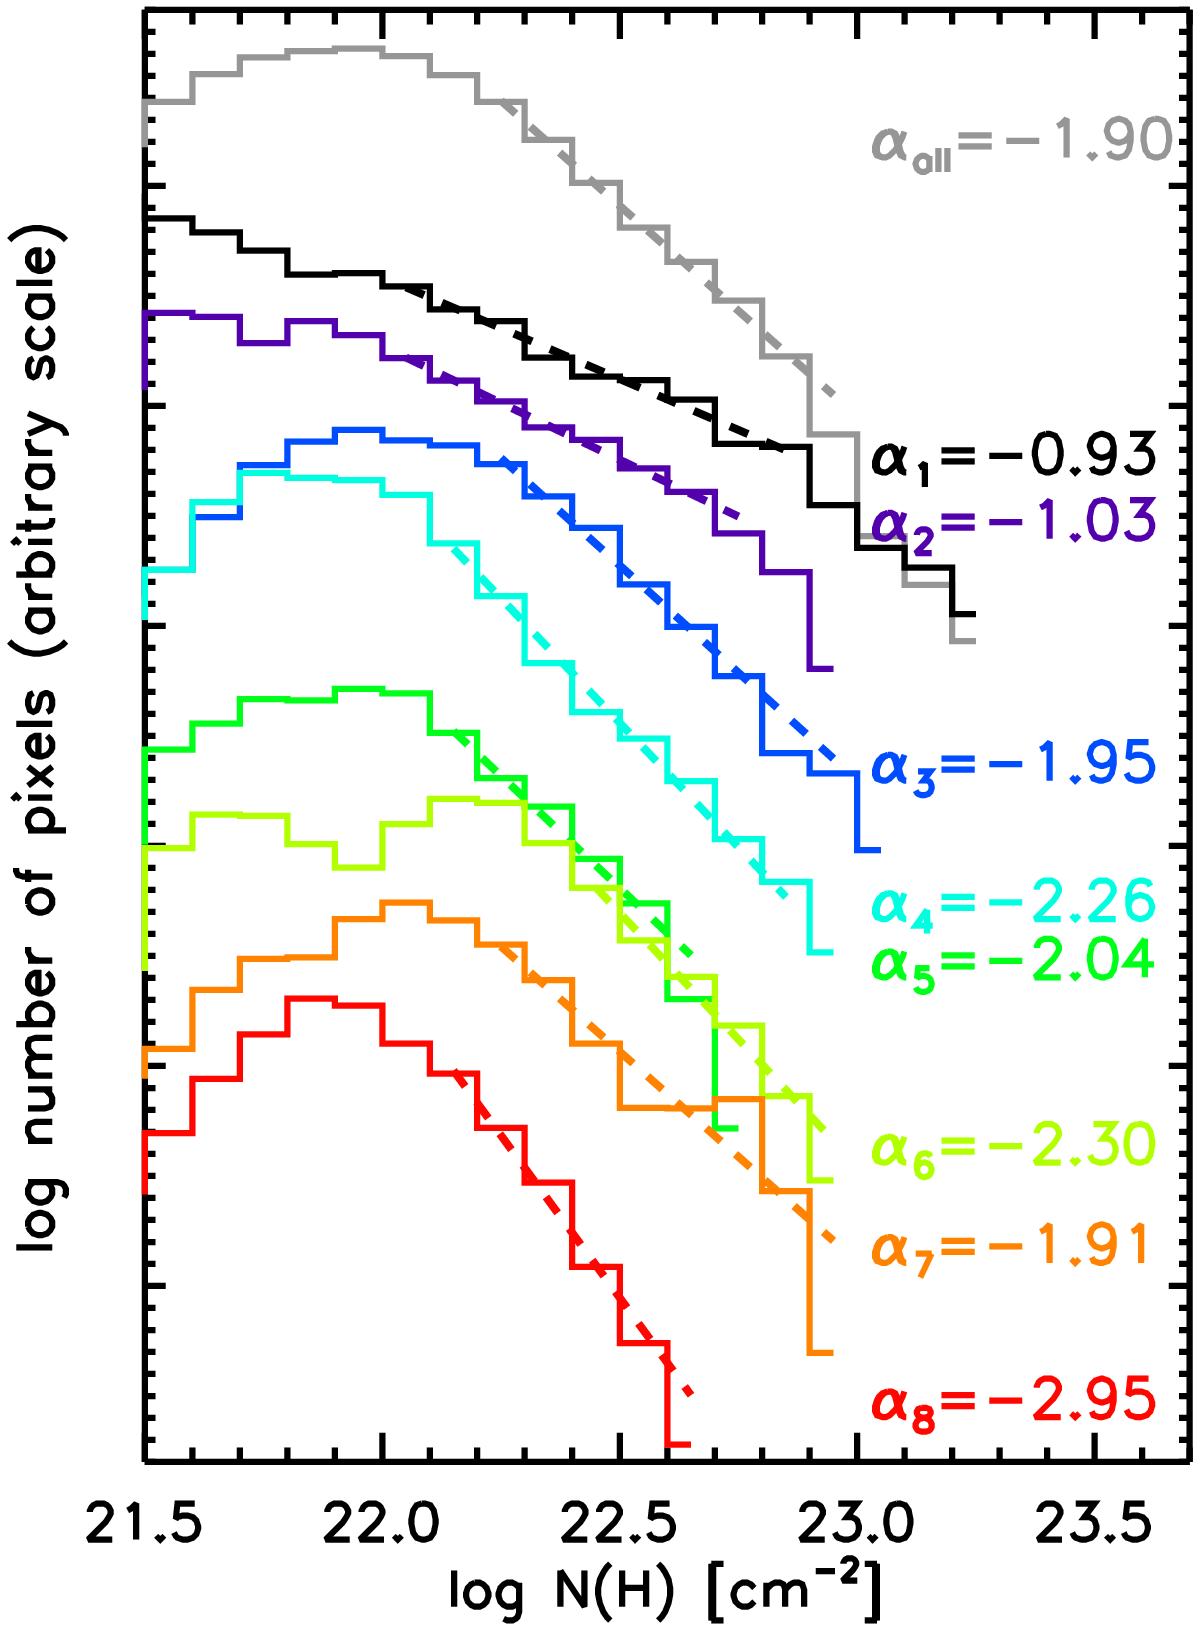
N(H) distributions for each region shown in Fig. 1. The combined N(H) distribution for all regions is shown in gray. The dashed curves show the best-fit slope assuming a power-law distribution of N(H); each value for the slope is listed (see Table 1 for slope errors). Here we show PDF data of bins containing more than 10 pixels, and each major tick mark represents a factor of 10. Mean-normalization, N(H) / ⟨ N(H) ⟩ in each region, has no effect on the derived PDF slopes because the operation simply results in a linear translation of the x-axis.
Current usage metrics show cumulative count of Article Views (full-text article views including HTML views, PDF and ePub downloads, according to the available data) and Abstracts Views on Vision4Press platform.
Data correspond to usage on the plateform after 2015. The current usage metrics is available 48-96 hours after online publication and is updated daily on week days.
Initial download of the metrics may take a while.