Fig. 5
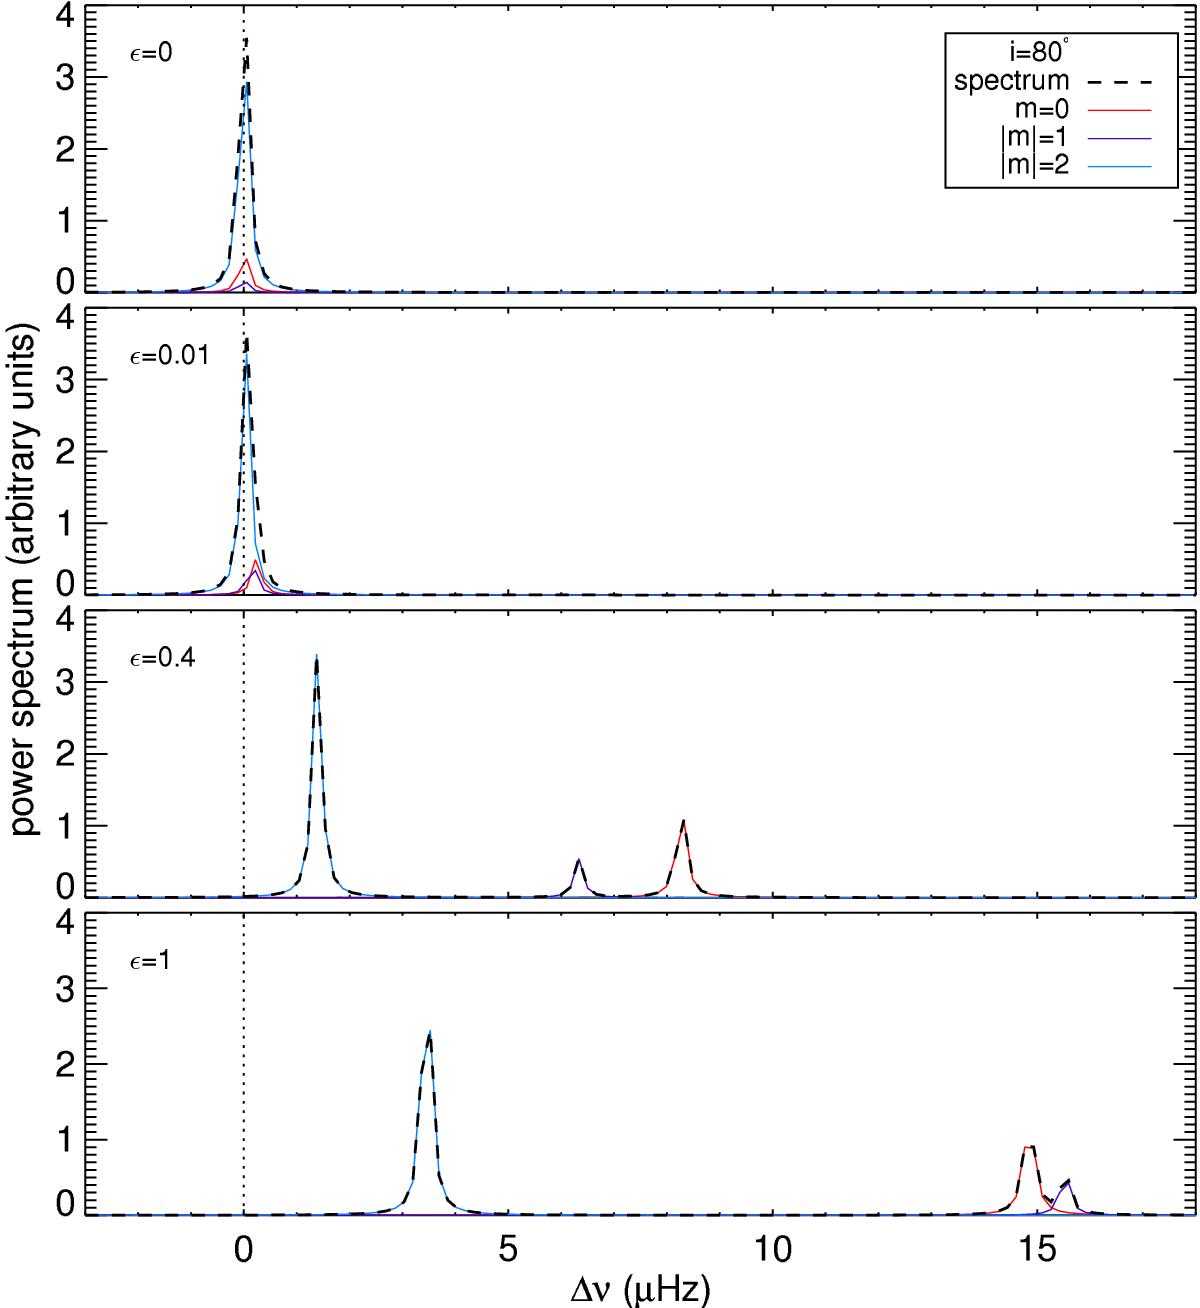
Acoustic power vs. Δν for ![]() , n = 12 and m = 0 (red), ±1 (violet), and ± 2 (blue) at an inclination angle i = 80°, for QS (ϵ = 0, upper panel) and for a spot located at a depth of 0.98 R⊙ and with ϵ = 0.01 (second upper panel), 0.4 (third upper panel), and 1.0 (bottom panel). The black dashed lines represent the spectra resulting from the sum of all the m components. Because of the initial conditions in Eq. (10), the observed acoustic power in the | m | > 0 modes is twice the power that would be observed in the case of stochastic excitation.
, n = 12 and m = 0 (red), ±1 (violet), and ± 2 (blue) at an inclination angle i = 80°, for QS (ϵ = 0, upper panel) and for a spot located at a depth of 0.98 R⊙ and with ϵ = 0.01 (second upper panel), 0.4 (third upper panel), and 1.0 (bottom panel). The black dashed lines represent the spectra resulting from the sum of all the m components. Because of the initial conditions in Eq. (10), the observed acoustic power in the | m | > 0 modes is twice the power that would be observed in the case of stochastic excitation.
Current usage metrics show cumulative count of Article Views (full-text article views including HTML views, PDF and ePub downloads, according to the available data) and Abstracts Views on Vision4Press platform.
Data correspond to usage on the plateform after 2015. The current usage metrics is available 48-96 hours after online publication and is updated daily on week days.
Initial download of the metrics may take a while.