Fig. 3
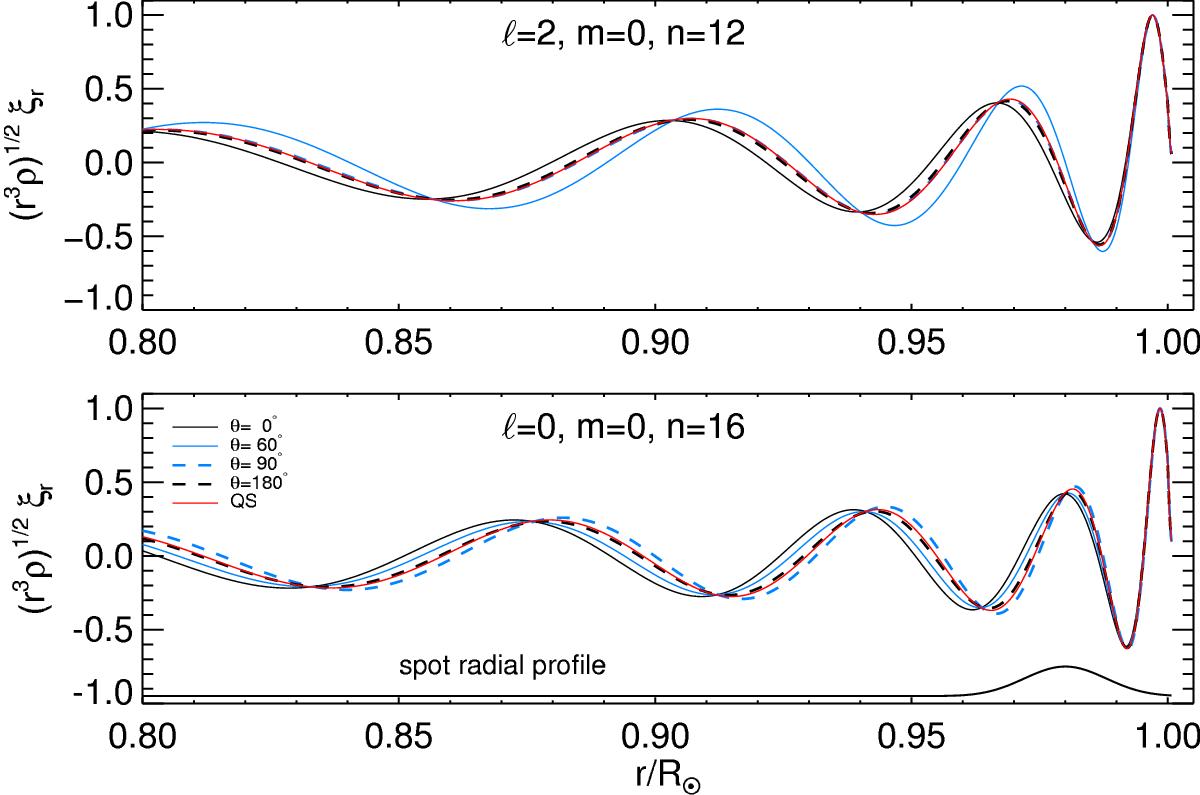
Normalized cuts at different colatitudes θ of the radial displacement eigenfunction (r3ρ)1/2ξr(r,θ) at the center of the spot (θ = 0, solid black line), at the edge (θ = 60°, solid blue line), and outside the spot (dashed lines), of the ![]() , m = 0, n = 12 mode (top) and
, m = 0, n = 12 mode (top) and ![]() , m = 0, n = 16 mode (bottom), for a polar spot with rc = 0.98 R⊙ and ϵ = 0.4. The solid red line is the corresponding ξr from ADIPLS. The solid black line in the bottom panel beneath the eigenfunctions shows the radial profile f of the spot. The blue and black dashed lines in the top panel completely overlap.
, m = 0, n = 16 mode (bottom), for a polar spot with rc = 0.98 R⊙ and ϵ = 0.4. The solid red line is the corresponding ξr from ADIPLS. The solid black line in the bottom panel beneath the eigenfunctions shows the radial profile f of the spot. The blue and black dashed lines in the top panel completely overlap.
Current usage metrics show cumulative count of Article Views (full-text article views including HTML views, PDF and ePub downloads, according to the available data) and Abstracts Views on Vision4Press platform.
Data correspond to usage on the plateform after 2015. The current usage metrics is available 48-96 hours after online publication and is updated daily on week days.
Initial download of the metrics may take a while.