Fig. 2
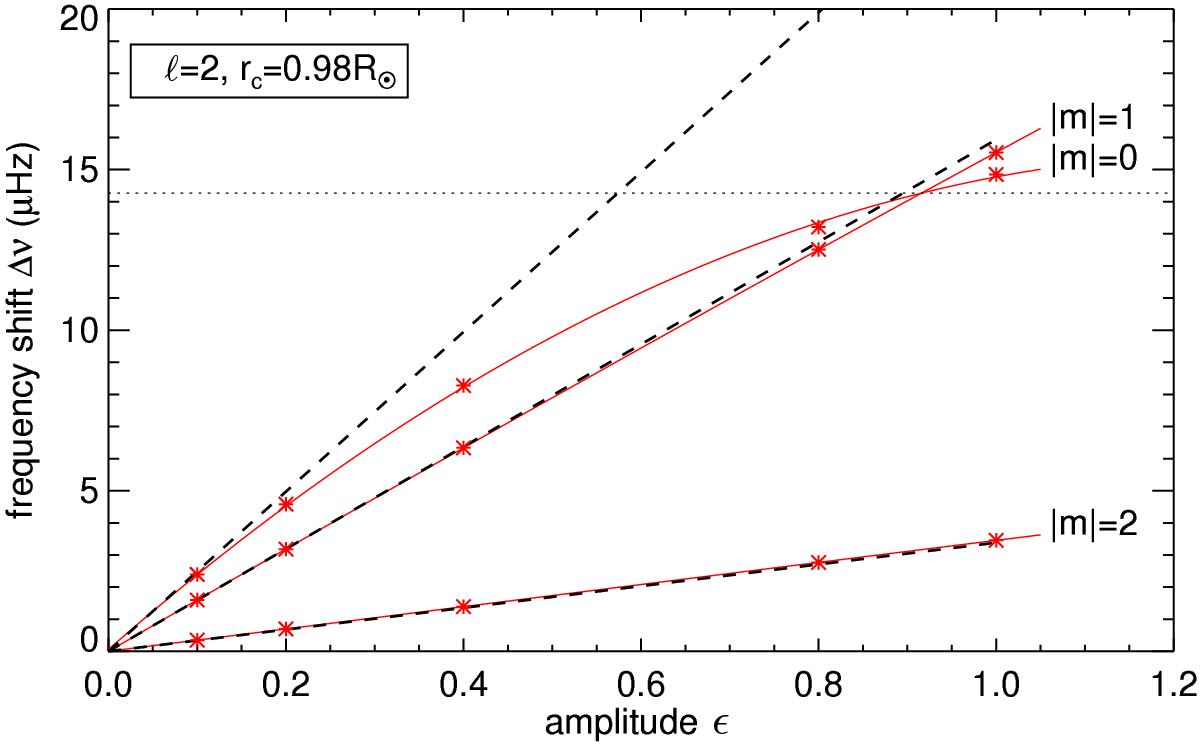
Mode frequency shifts Δν vs. spot amplitude ϵ for modes with ℓ = 2, n = 12 and | m | = 0,1,2 in the case of a polar spot model with rc = 0.98. The QS eigenfrequency for these modes is ν0 = 1970.50 ± 0.16 μHz. Dashed lines represent linear frequency shifts given by Eq. (9), red asterisks are frequency shifts from numerical simulations. Solid red lines represent parabolic fits to the shifts. The horizontal dotted line shows the crossing of the frequencies between the m = 0 and | m | = 1 modes at ϵ ≃ 0.92.
Current usage metrics show cumulative count of Article Views (full-text article views including HTML views, PDF and ePub downloads, according to the available data) and Abstracts Views on Vision4Press platform.
Data correspond to usage on the plateform after 2015. The current usage metrics is available 48-96 hours after online publication and is updated daily on week days.
Initial download of the metrics may take a while.