Fig. 1
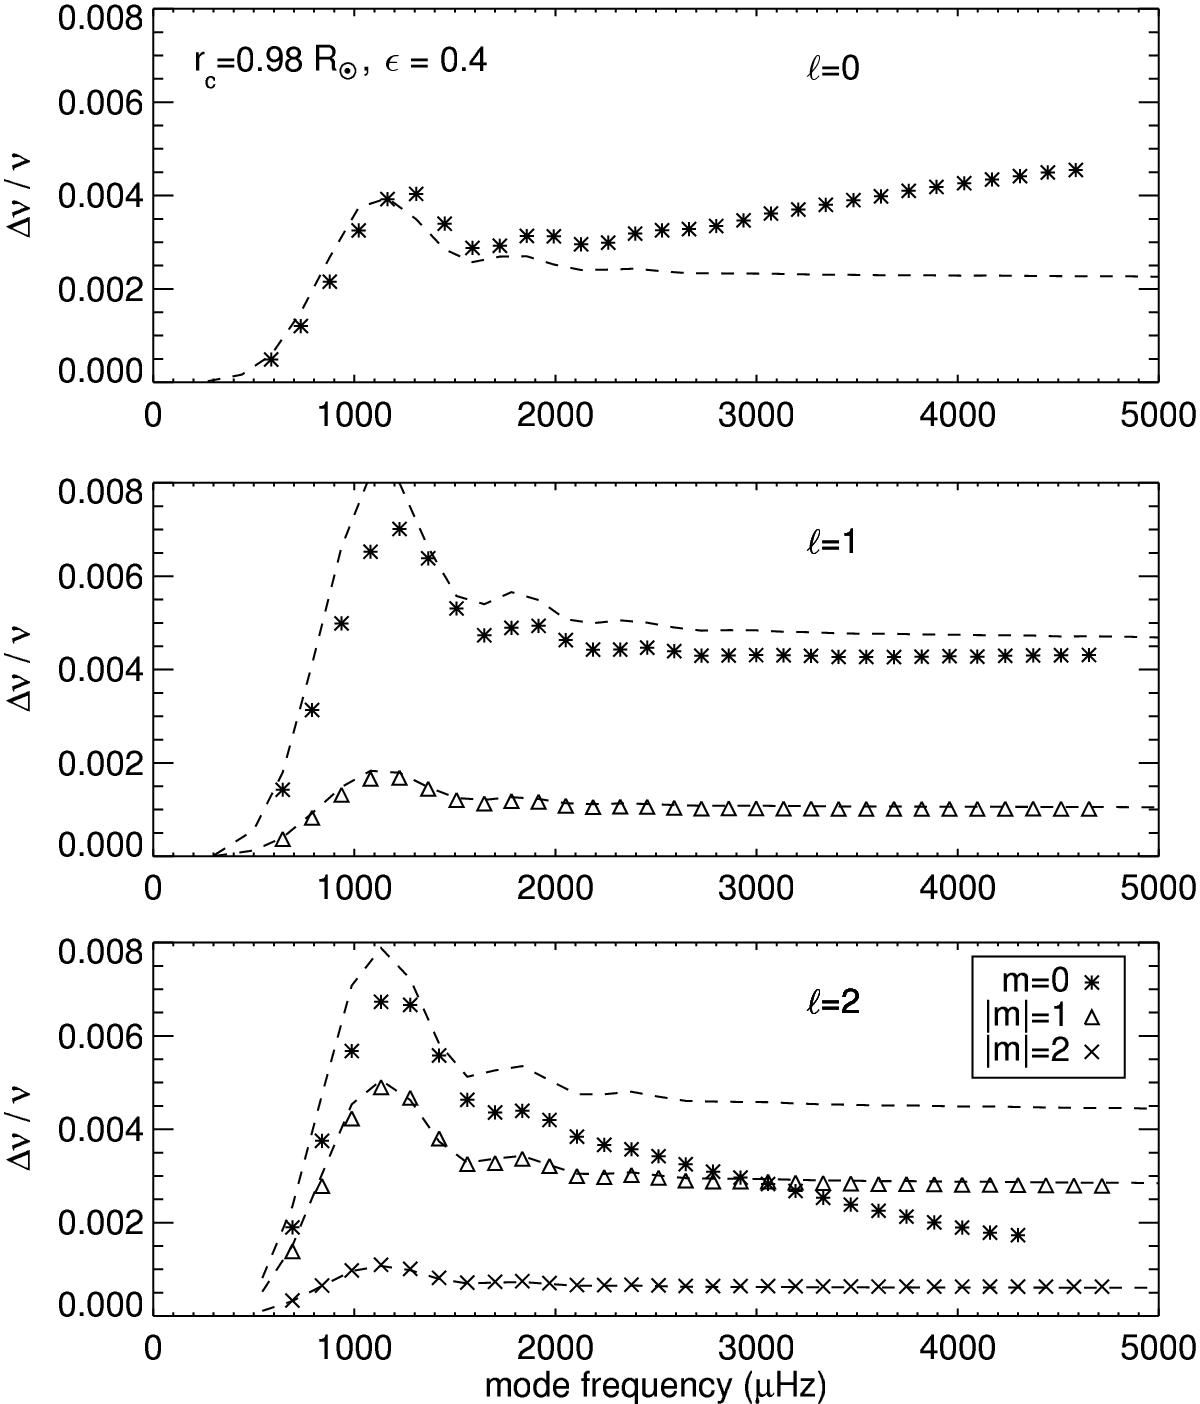
Relative frequency shifts Δν/ν vs. mode frequency ν for modes with ℓ = 0 (upper panel), ℓ = 1 (middle panel) and ℓ = 2 (bottom panel), for a polar spot model relative to QS model with rc = 0.98 R⊙ and ϵ = 0.4. Dashed lines represent linear frequency shifts given by Eq. (9). Fitted frequencies from numerical simulations (asterisks for m = 0, triangles for | m | = 1, and crosses for | m | = 2) show the nonlinear behavior of the shifts for m = 0 modes (asterisks). We note that m = 0 and | m | = 1 mode frequencies for ℓ = 2 cross at ν ≃ 3060 μHz.
Current usage metrics show cumulative count of Article Views (full-text article views including HTML views, PDF and ePub downloads, according to the available data) and Abstracts Views on Vision4Press platform.
Data correspond to usage on the plateform after 2015. The current usage metrics is available 48-96 hours after online publication and is updated daily on week days.
Initial download of the metrics may take a while.