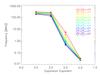
Fig. 4
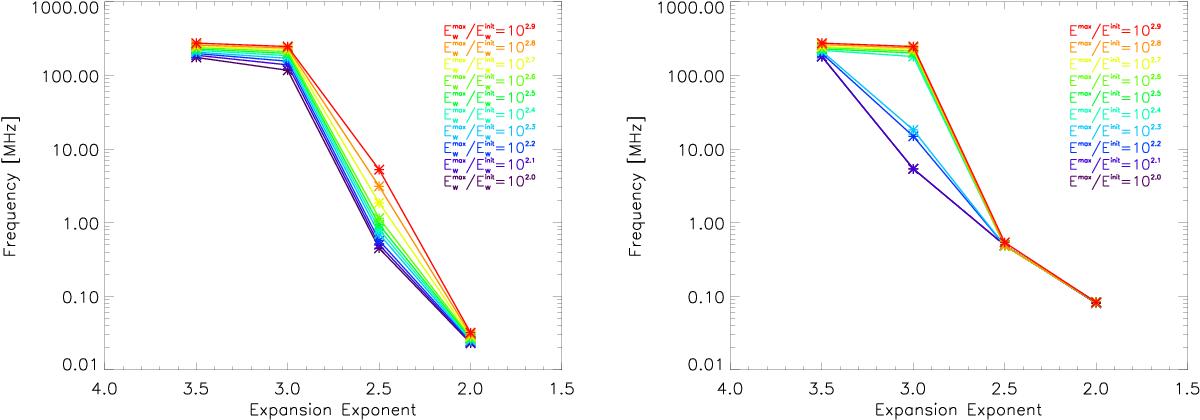
Minimum frequency (stopping frequency) where an electron beam is able to induce certain amount of Langmuir wave energy density (see colour-coded lines). plotted against the different radial expansion exponents, β. The different coloured lines represent different levels of Langmuir wave energy (normalised by the thermal level) between 100 and 1000. The right graph includes density fluctuations in the background plasma.
Current usage metrics show cumulative count of Article Views (full-text article views including HTML views, PDF and ePub downloads, according to the available data) and Abstracts Views on Vision4Press platform.
Data correspond to usage on the plateform after 2015. The current usage metrics is available 48-96 hours after online publication and is updated daily on week days.
Initial download of the metrics may take a while.