Free Access
Fig. 9
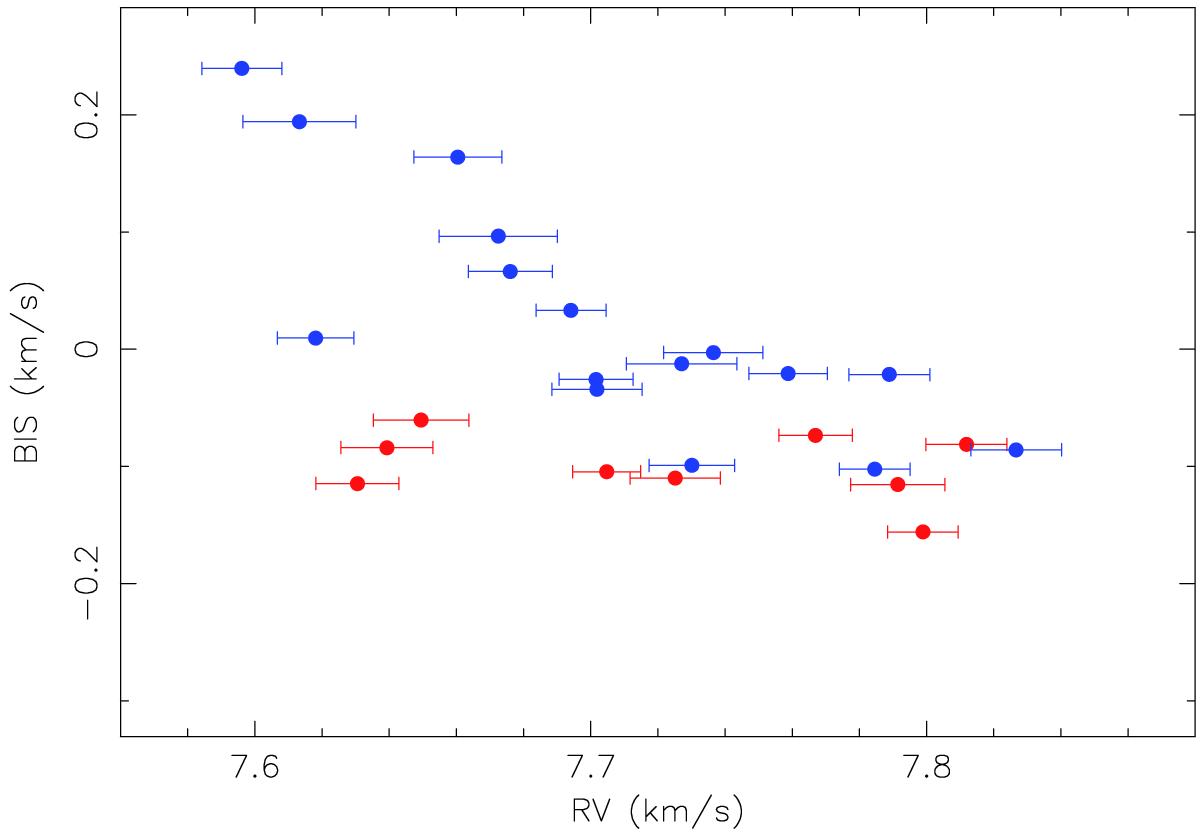
RV vs. BIS for CORALIE data. Blue symbols represent flare-affected data for CORALIE both runs. Red symbols represent the data without flare activity. Error bars for BIS are about 0.0001 km s-1.
Current usage metrics show cumulative count of Article Views (full-text article views including HTML views, PDF and ePub downloads, according to the available data) and Abstracts Views on Vision4Press platform.
Data correspond to usage on the plateform after 2015. The current usage metrics is available 48-96 hours after online publication and is updated daily on week days.
Initial download of the metrics may take a while.