Fig. 5
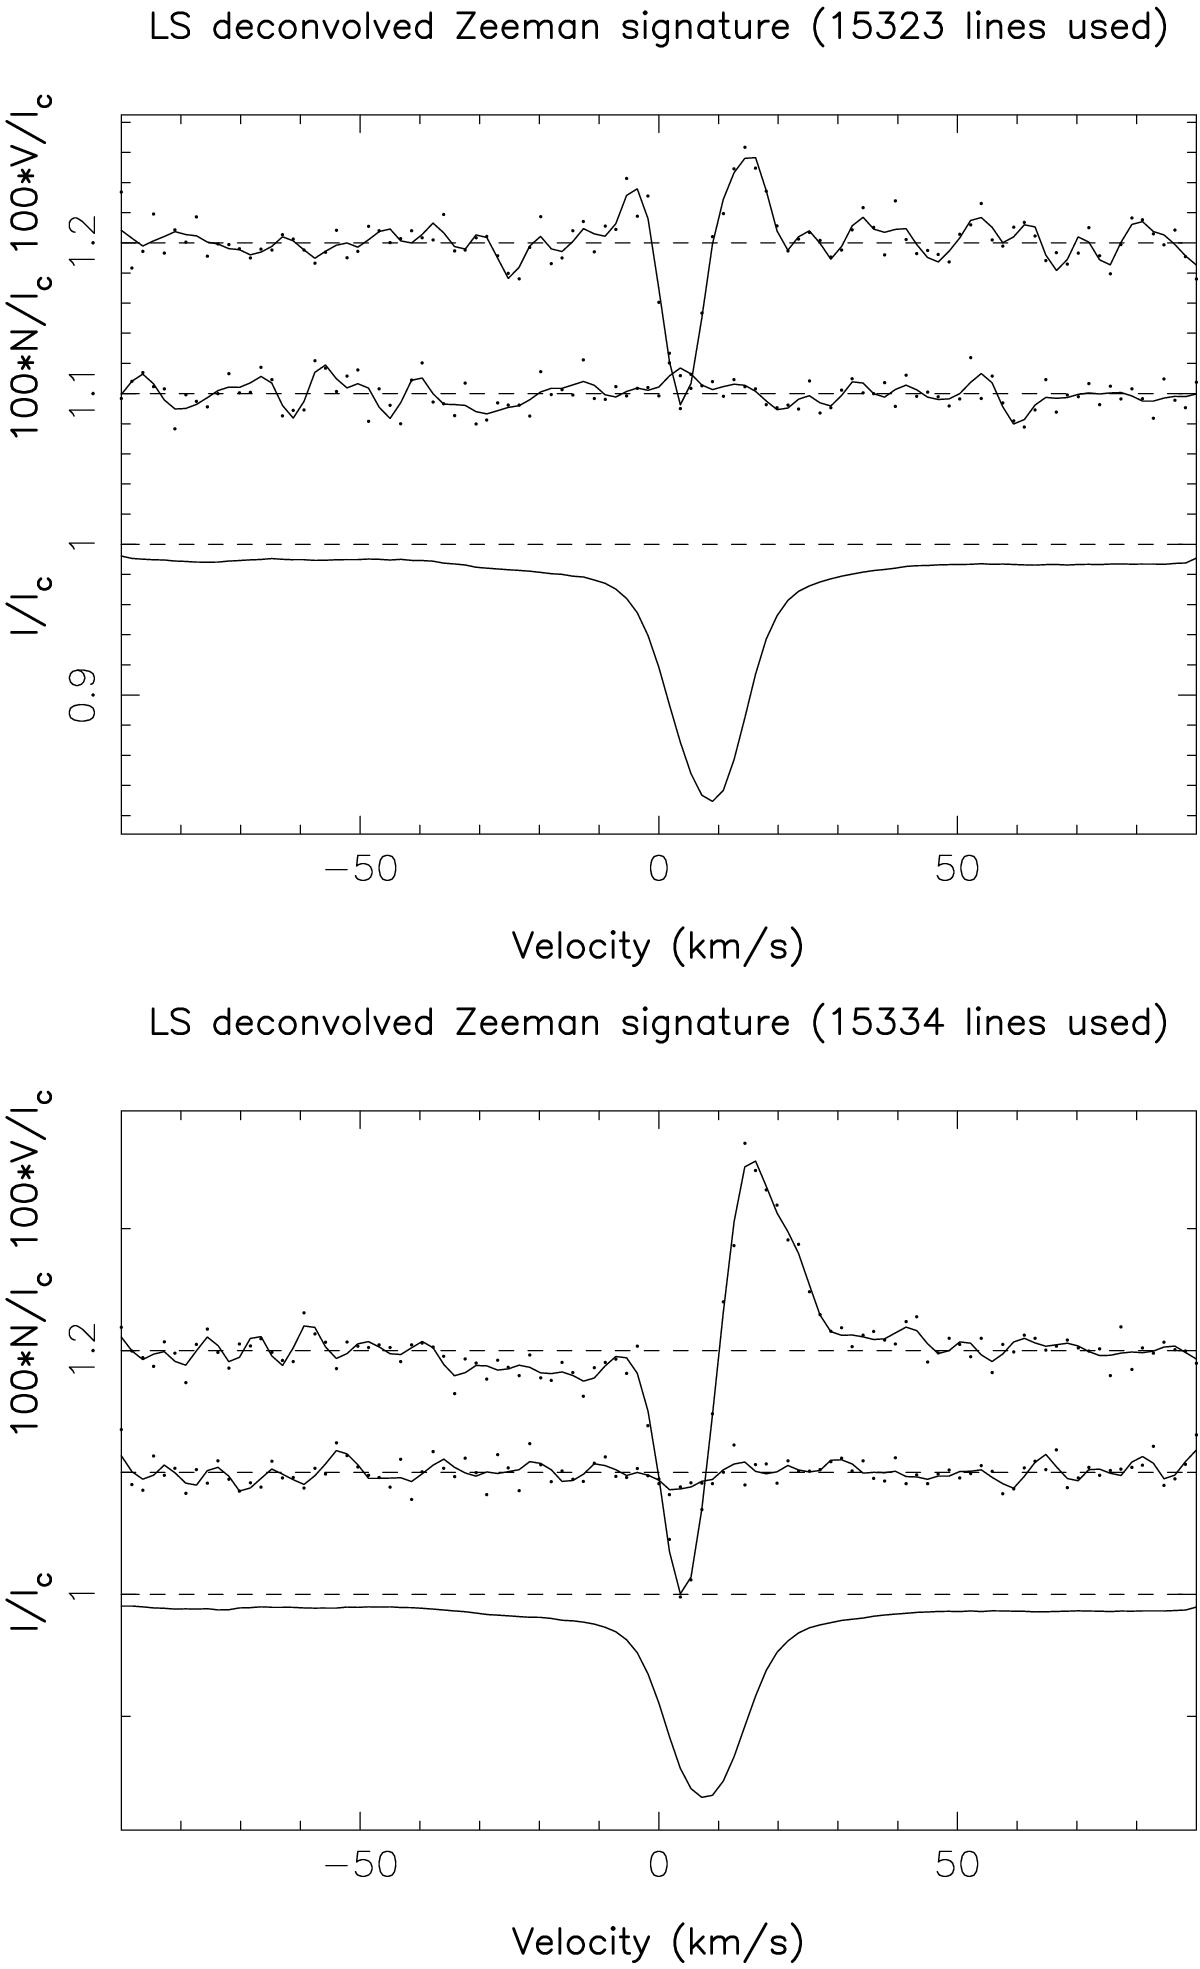
LSD profiles of BD+20 1790 for 2013 April 22 (top panel) and 2013 May 04 (bottom panel). For each panel, the upper plot shows the Stokes V LSD profile (normalized to the continuum level, expanded by 100 times and shifted up by 0.2), the middle plot shows the Null LSD profile (again normalized expanded by 100 times and shifted up by 0.1) and the lower plot shows the Stokes I normalized LSD profile.

Current usage metrics show cumulative count of Article Views (full-text article views including HTML views, PDF and ePub downloads, according to the available data) and Abstracts Views on Vision4Press platform.
Data correspond to usage on the plateform after 2015. The current usage metrics is available 48-96 hours after online publication and is updated daily on week days.
Initial download of the metrics may take a while.