Fig. 3
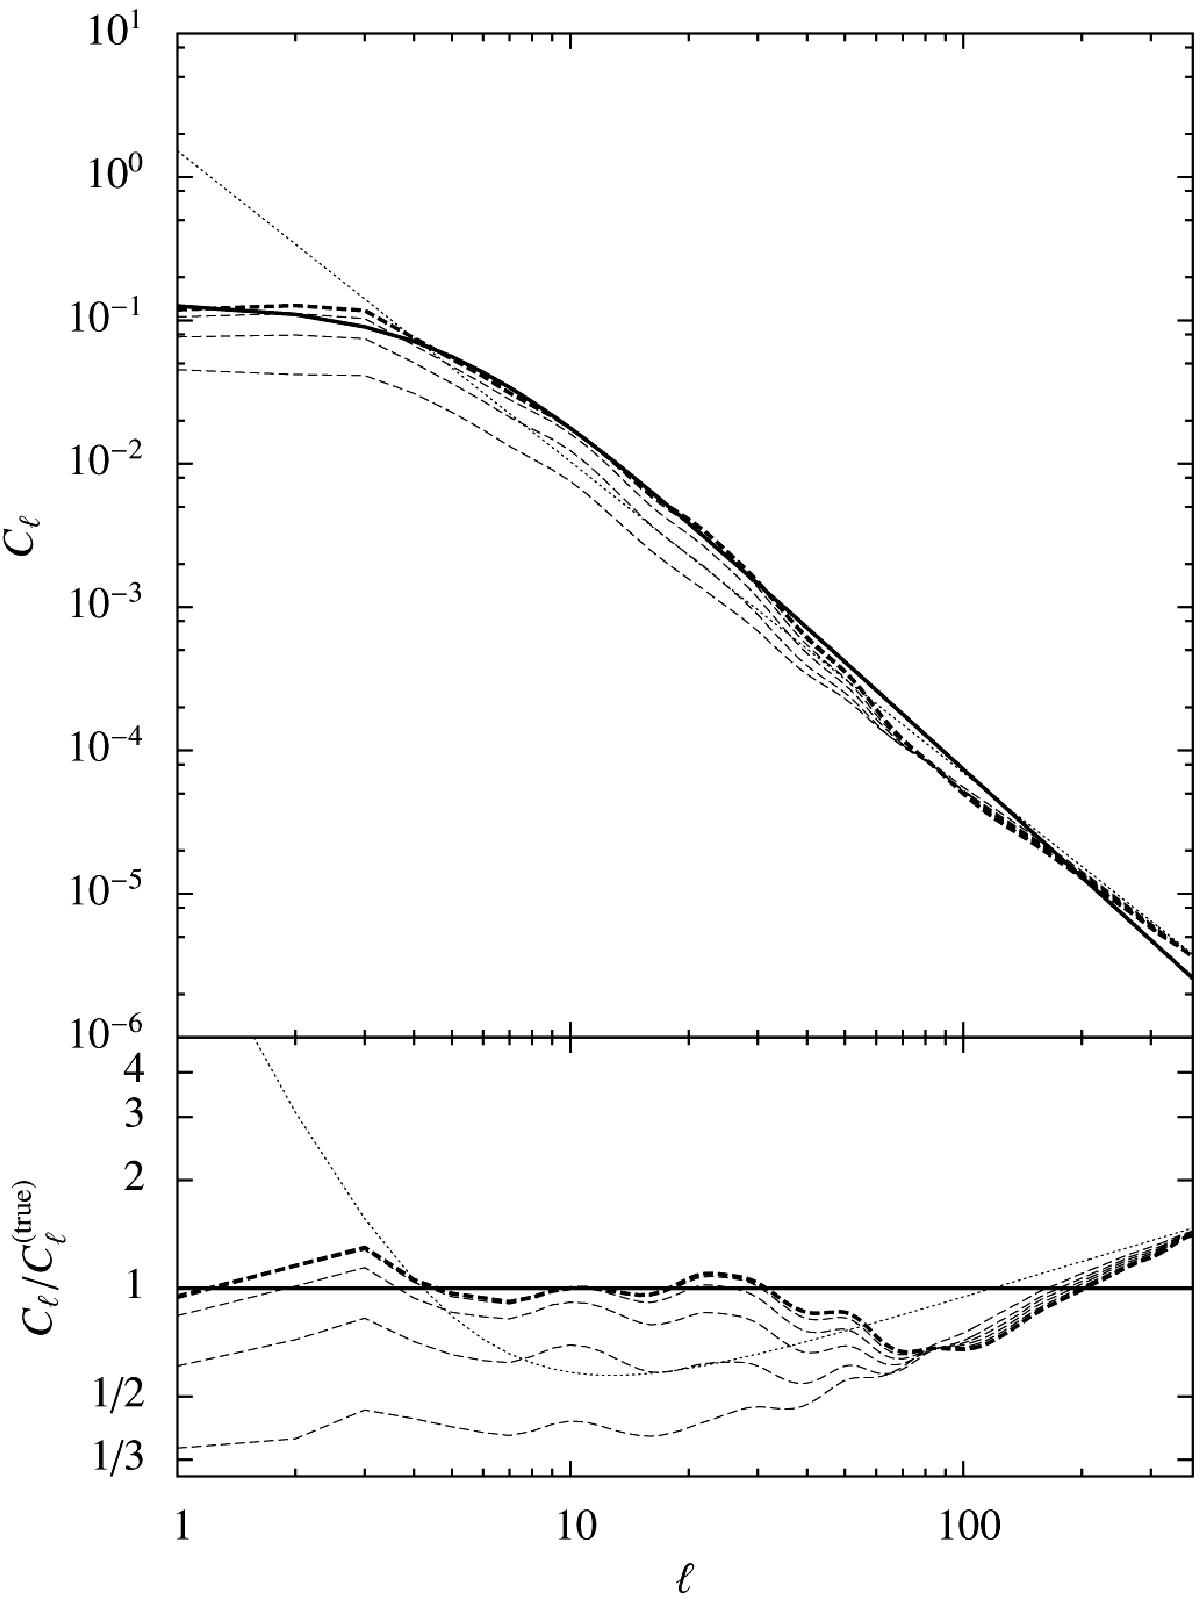
Angular power spectrum of the simulated dimensionless version of the Galactic Faraday depth and its reconstructions. The thick solid line is the simulated power spectrum, the thin dotted line shows the initial guess, the thin dashed lines are subsequent reconstructions, and the thick dashed line is the final reconstruction. Shown are the reconstructions at the end of each iteration with fixed Galactic latitude profile. In the bottom panel, we show the ratio of the reconstructed power spectra and the one used in the simulation.
Current usage metrics show cumulative count of Article Views (full-text article views including HTML views, PDF and ePub downloads, according to the available data) and Abstracts Views on Vision4Press platform.
Data correspond to usage on the plateform after 2015. The current usage metrics is available 48-96 hours after online publication and is updated daily on week days.
Initial download of the metrics may take a while.