Fig. A.1
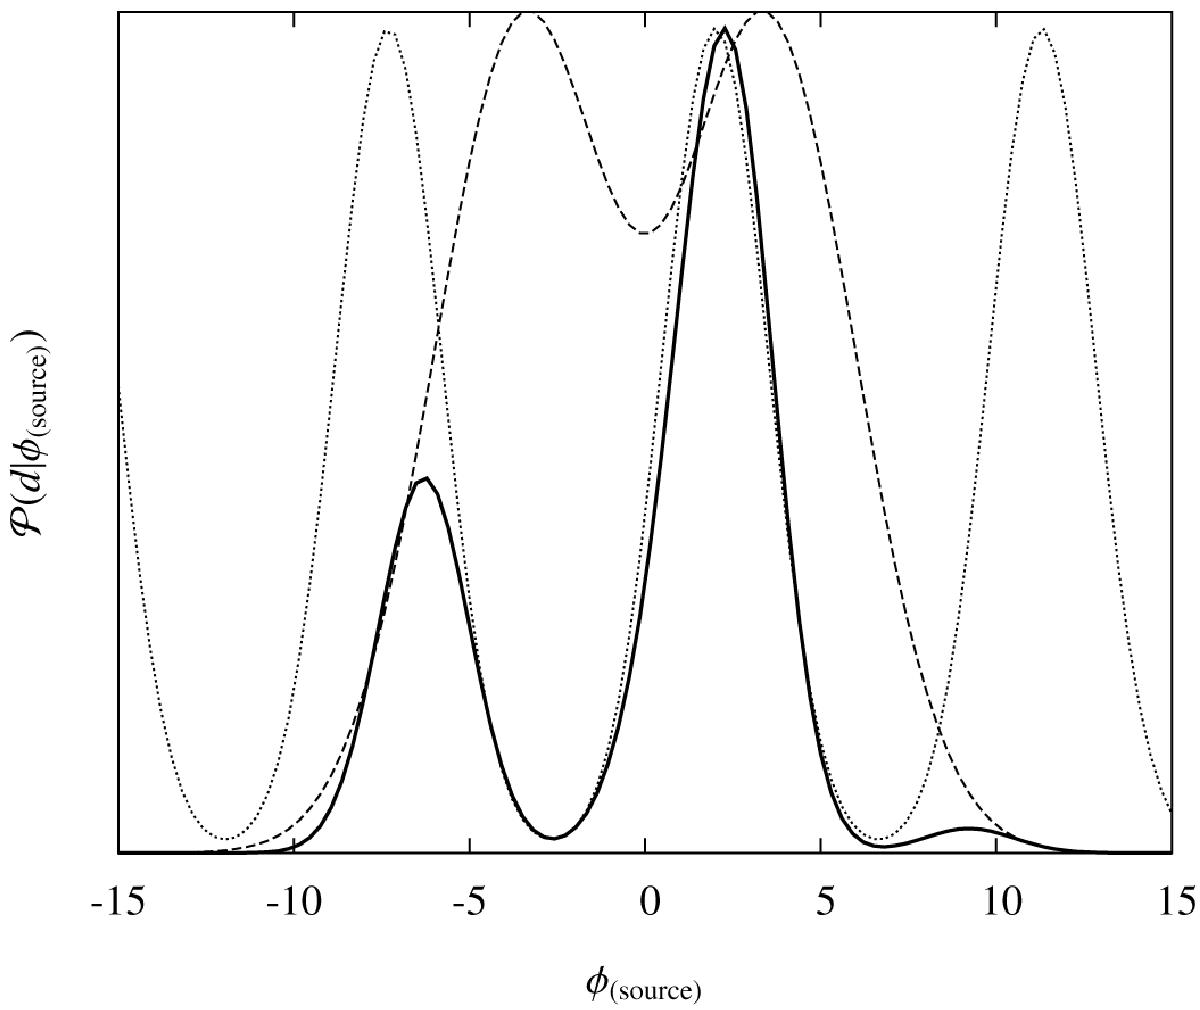
Illustration of a possible likelihood curve for a single Faraday depth measurement. The dotted line shows the likelihood arising from the n–π ambiguity of position angle measurements and the uncertainty in these measurements. The dashed curve shows an additional constraint on the magnitude of the source’s Faraday depth and the solid curve is the resulting combined likelihood curve, i.e., the product of the dotted and dashed curves. The plotted curves have been arbitrarily rescaled to show similar amplitudes.
Current usage metrics show cumulative count of Article Views (full-text article views including HTML views, PDF and ePub downloads, according to the available data) and Abstracts Views on Vision4Press platform.
Data correspond to usage on the plateform after 2015. The current usage metrics is available 48-96 hours after online publication and is updated daily on week days.
Initial download of the metrics may take a while.