Fig. 5
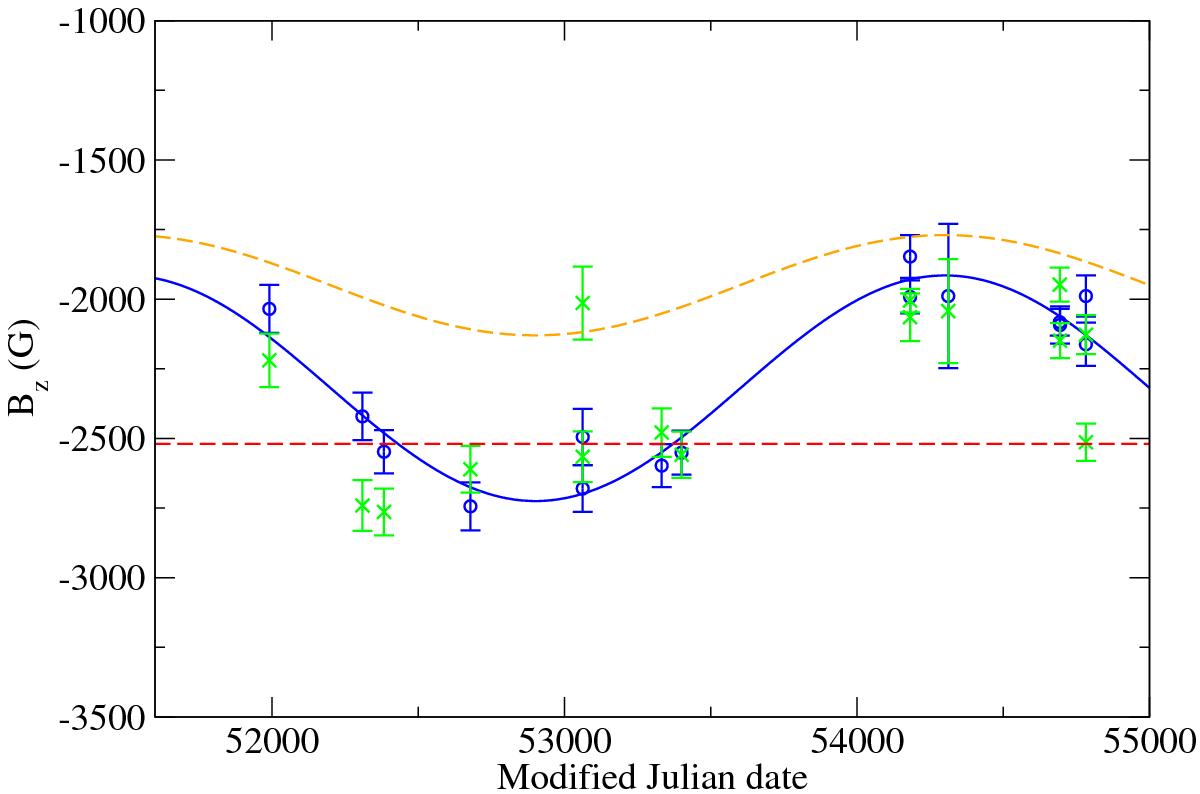
Variation of ⟨ Bz ⟩ for HD 94660 with MJD as measured using Balmer lines (blue error bars with circles), and metallic spectrum (green error bars with x’s), for data obtained using the 600 B and 1200 B grisms. The solid smooth curve is best sine wave fit to ⟨ Bz ⟩ measured using Balmer lines, assuming P = 2800 d. The dashed straight red line is the approximately constant field reported by Bohlender et al. (1993); the dashed orange curve is the sine wave fit to CASPEC ⟨ Bz ⟩ measurements described by Landstreet & Mathys (2000).
Current usage metrics show cumulative count of Article Views (full-text article views including HTML views, PDF and ePub downloads, according to the available data) and Abstracts Views on Vision4Press platform.
Data correspond to usage on the plateform after 2015. The current usage metrics is available 48-96 hours after online publication and is updated daily on week days.
Initial download of the metrics may take a while.