Fig. 9
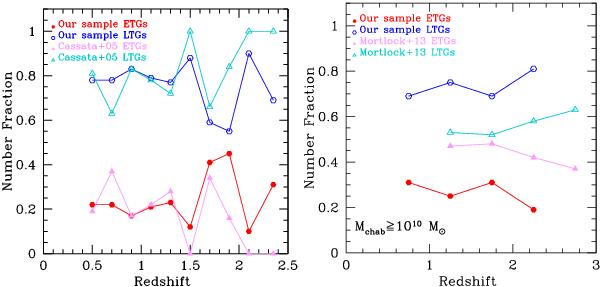
Comparison of the morphological fractions of our morphological sample (ETGs in red, LTGs in blue) with the ones derived by (Cassata et al. 2005, left panel) and (Mortlock et al. 2013, right panel). ETGs and LTGs of the other authors are shown in pink and cyan, respectively. The redshift binning is chosen in order to best reproduce the other works intervals.
Current usage metrics show cumulative count of Article Views (full-text article views including HTML views, PDF and ePub downloads, according to the available data) and Abstracts Views on Vision4Press platform.
Data correspond to usage on the plateform after 2015. The current usage metrics is available 48-96 hours after online publication and is updated daily on week days.
Initial download of the metrics may take a while.