Fig. 14
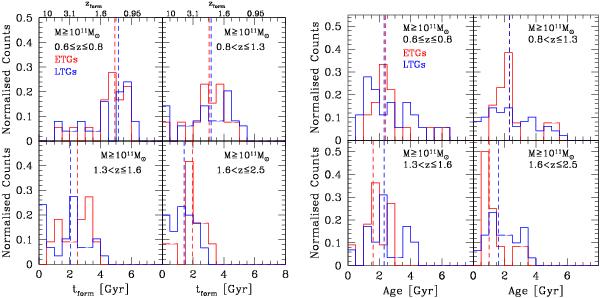
Distributions of formation epochs (left panels) and ages (right panel) of the stellar component of massive galaxies (M∗ ≥ 1011 M⊙) split into four redshift bins. Red and blue represent the ETGs and LTGs classes. Dotted vertical lines represent the median values. In the left panels the formation redshift zform (zform = z(tform)) is indicated on the topx-axis.
Current usage metrics show cumulative count of Article Views (full-text article views including HTML views, PDF and ePub downloads, according to the available data) and Abstracts Views on Vision4Press platform.
Data correspond to usage on the plateform after 2015. The current usage metrics is available 48-96 hours after online publication and is updated daily on week days.
Initial download of the metrics may take a while.