Fig. 11
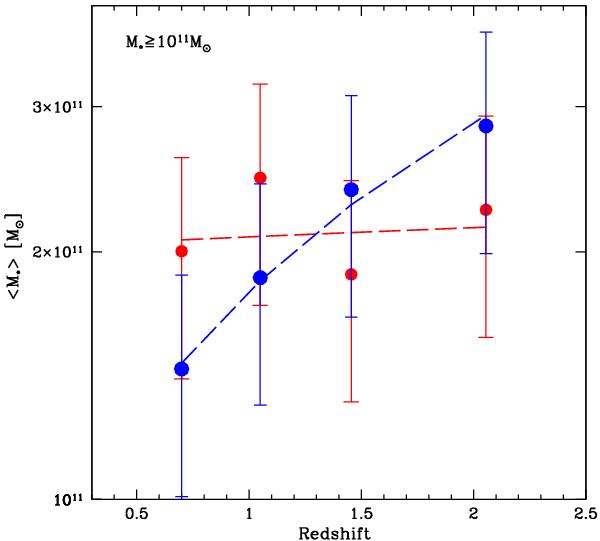
Mean stellar mass as a function of redshift for the sample of galaxies more massive than M∗ ≥ 1011M⊙. Red and blue refer to the morphological classes of early- and late-type galaxies. The dotted lines represent a weighted least squares fit to the points. Error bars represent the typical uncertainty (30%) we assumed on the stellar masses.
Current usage metrics show cumulative count of Article Views (full-text article views including HTML views, PDF and ePub downloads, according to the available data) and Abstracts Views on Vision4Press platform.
Data correspond to usage on the plateform after 2015. The current usage metrics is available 48-96 hours after online publication and is updated daily on week days.
Initial download of the metrics may take a while.