Fig. 1
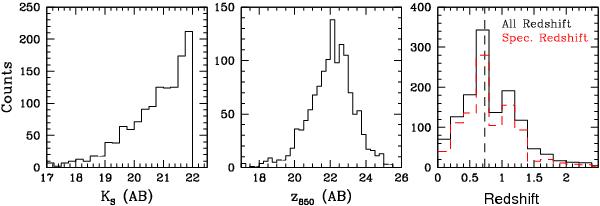
Left and centre: apparent magnitude distributions of the sample of 1302 galaxies in the Ks and z850 bands. Right: redshift distribution of the Ks ≤ 22 sample. The continuous black line and the dashed red line indicate the whole sample and the objects with spectroscopic redshift, respectively. The vertical dotted line at z ~ 0.74 indicates the median of redshift distribution.
Current usage metrics show cumulative count of Article Views (full-text article views including HTML views, PDF and ePub downloads, according to the available data) and Abstracts Views on Vision4Press platform.
Data correspond to usage on the plateform after 2015. The current usage metrics is available 48-96 hours after online publication and is updated daily on week days.
Initial download of the metrics may take a while.