Free Access
Fig. 8
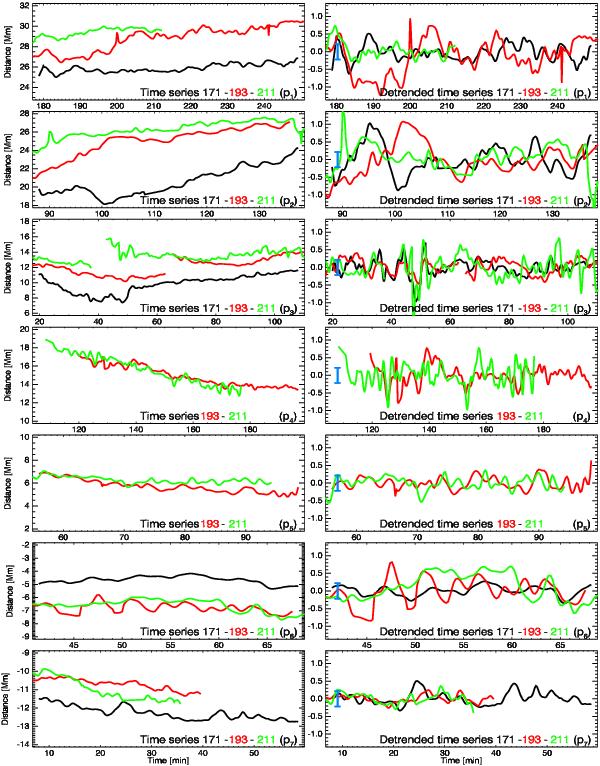
Oscillatory patterns for the 171 (black), 193 (red), and 211 Å (green) obtained from the corresponding TD maps of Fig. 5. Each time series is independently detrended by some low-degree polynomial functions and shown in the right column of plots. The blue error bar shows the AIA pixel resolution equivalent to ~0.4 Mm.
Current usage metrics show cumulative count of Article Views (full-text article views including HTML views, PDF and ePub downloads, according to the available data) and Abstracts Views on Vision4Press platform.
Data correspond to usage on the plateform after 2015. The current usage metrics is available 48-96 hours after online publication and is updated daily on week days.
Initial download of the metrics may take a while.