Fig. 5
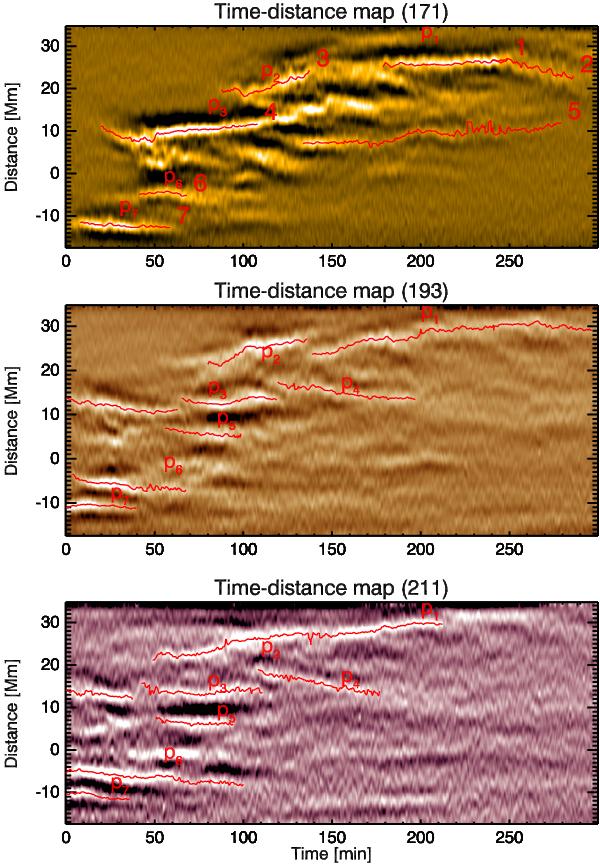
Filtered TD maps at 171 (top), 193 (middle), and 211 Å (bottom). Oscillatory patterns obtained with an automatic Gaussian fitting are marked in red. The numbers shown are specifically related to the oscillatory patterns detected at 171 Å. The series of labels “p” refers to some segments of the patterns extracted and compared between 171, 193, and 211 Å, which are simultaneous and apparently from the same locations.
Current usage metrics show cumulative count of Article Views (full-text article views including HTML views, PDF and ePub downloads, according to the available data) and Abstracts Views on Vision4Press platform.
Data correspond to usage on the plateform after 2015. The current usage metrics is available 48-96 hours after online publication and is updated daily on week days.
Initial download of the metrics may take a while.