Fig. 4
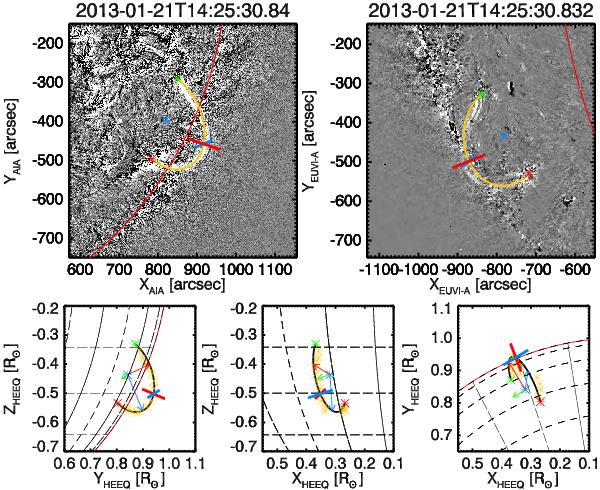
Top: geometry reconstruction of the loop in 3D (yellow line) using difference images of SDO/AIA 193 (top left) and STEREO/EUVI-A 195 (top right) views. The northern loop footpoint is in green, whilst the southern one is in red, in blue the loop centre. The vertical (red) and horizontal (blue) slit is over-plotted. Bottom: projections of the loop in different orientations of the Heliocentric Earth EQuatorial (HEEQ) coordinate system. Distance are expressed in solar radii (R⊙) units. The 3D data points are plotted as yellow points and fitted by the black line. The green, red and blue arrows mark respectively the normal plane, the minor and major radius of the loop. The red and blue lines at the loop apex locate the vertical and horizontal slits.
Current usage metrics show cumulative count of Article Views (full-text article views including HTML views, PDF and ePub downloads, according to the available data) and Abstracts Views on Vision4Press platform.
Data correspond to usage on the plateform after 2015. The current usage metrics is available 48-96 hours after online publication and is updated daily on week days.
Initial download of the metrics may take a while.