Fig. 2
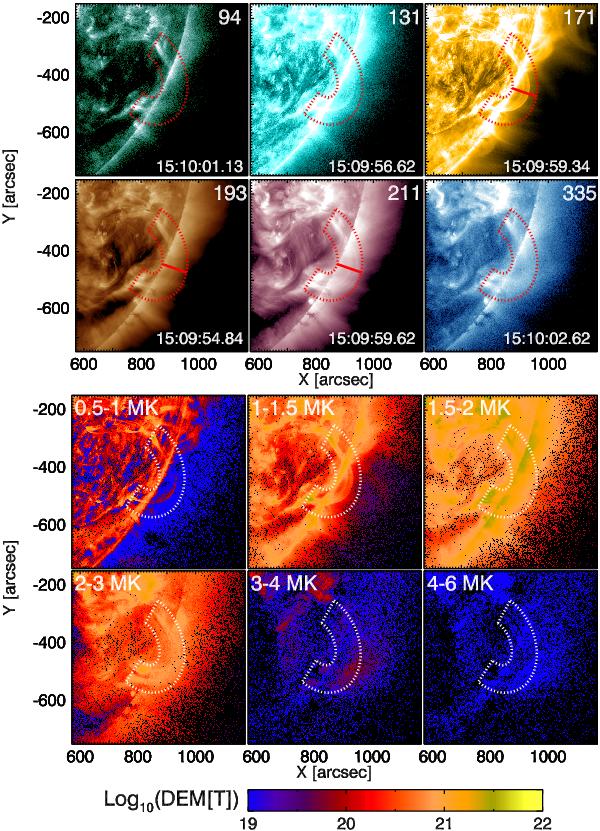
Top: loop at six EUV wavebands of SDO/AIA. From the left we have 94, 131, 171 Å (top row) and 193, 211, 335 Å (bottom row). Bottom: DEM maps of the studied region at different temperature ranges. In both panels, the loop is enclosed in a dotted region. The continuous line located at the loop top at 171, 193, and 211 Å marks the position of the slit.

Current usage metrics show cumulative count of Article Views (full-text article views including HTML views, PDF and ePub downloads, according to the available data) and Abstracts Views on Vision4Press platform.
Data correspond to usage on the plateform after 2015. The current usage metrics is available 48-96 hours after online publication and is updated daily on week days.
Initial download of the metrics may take a while.