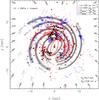
Fig. 14
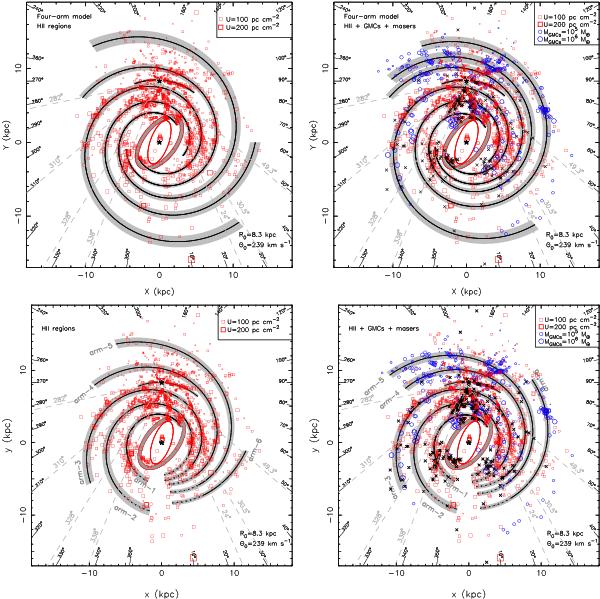
Upper panels: distributions of HII regions (left) and all three kinds of spiral tracers (right) with the flat rotation curve with newly observed R0 = 8.3 kpc and Θ0 = 239 km s-1 (Brunthaler et al. 2011). The symbols are the same as those in Fig. 2. The best-fitted four-arm models are also shown. Lower panels: best-fitted PL models for these two distributions are presented.
Current usage metrics show cumulative count of Article Views (full-text article views including HTML views, PDF and ePub downloads, according to the available data) and Abstracts Views on Vision4Press platform.
Data correspond to usage on the plateform after 2015. The current usage metrics is available 48-96 hours after online publication and is updated daily on week days.
Initial download of the metrics may take a while.