Fig. 9
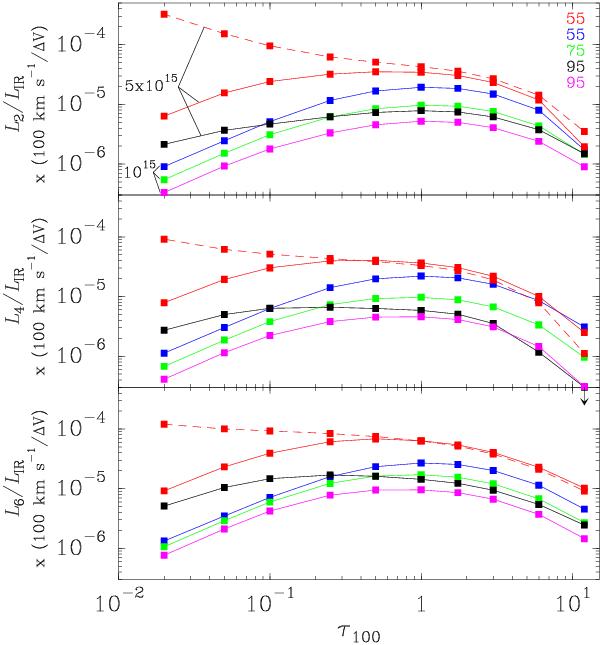
Modeled LH2O/LIR × (100 km s-1/ ΔV) values for lines 2 (upper), 4 (middle), and 6 (lower) as a function of τ100. Collisional excitation is ignored except for the red dashed lines, where Tgas = 150 K and nH2 = 3 × 105 cm-3 are adopted. The small numbers on the right side of the upper panel indicate the value of Tdust in K, and those on the left side indicate NH2O/ΔV in cm-2/(km s-1). When compared with observations, the modeled LIR values should be considered a fraction of the observed IR luminosities (Sect. 4.3.1). For τ100 = 12 and Tdust = 95 K, line 4 is predicted to be in absorption. For fixed Tdust and τ100 ~ 1, the LH2O/LIR ratios are similar for very different NH2O, indicating line saturation.
Current usage metrics show cumulative count of Article Views (full-text article views including HTML views, PDF and ePub downloads, according to the available data) and Abstracts Views on Vision4Press platform.
Data correspond to usage on the plateform after 2015. The current usage metrics is available 48-96 hours after online publication and is updated daily on week days.
Initial download of the metrics may take a while.